Guamanian/Chamorro vs Immigrants from Colombia 7th Grade
COMPARE
Guamanian/Chamorro
Immigrants from Colombia
7th Grade
7th Grade Comparison
Guamanians/Chamorros
Immigrants from Colombia
95.9%
7TH GRADE
23.5/ 100
METRIC RATING
199th/ 347
METRIC RANK
95.1%
7TH GRADE
0.2/ 100
METRIC RATING
275th/ 347
METRIC RANK
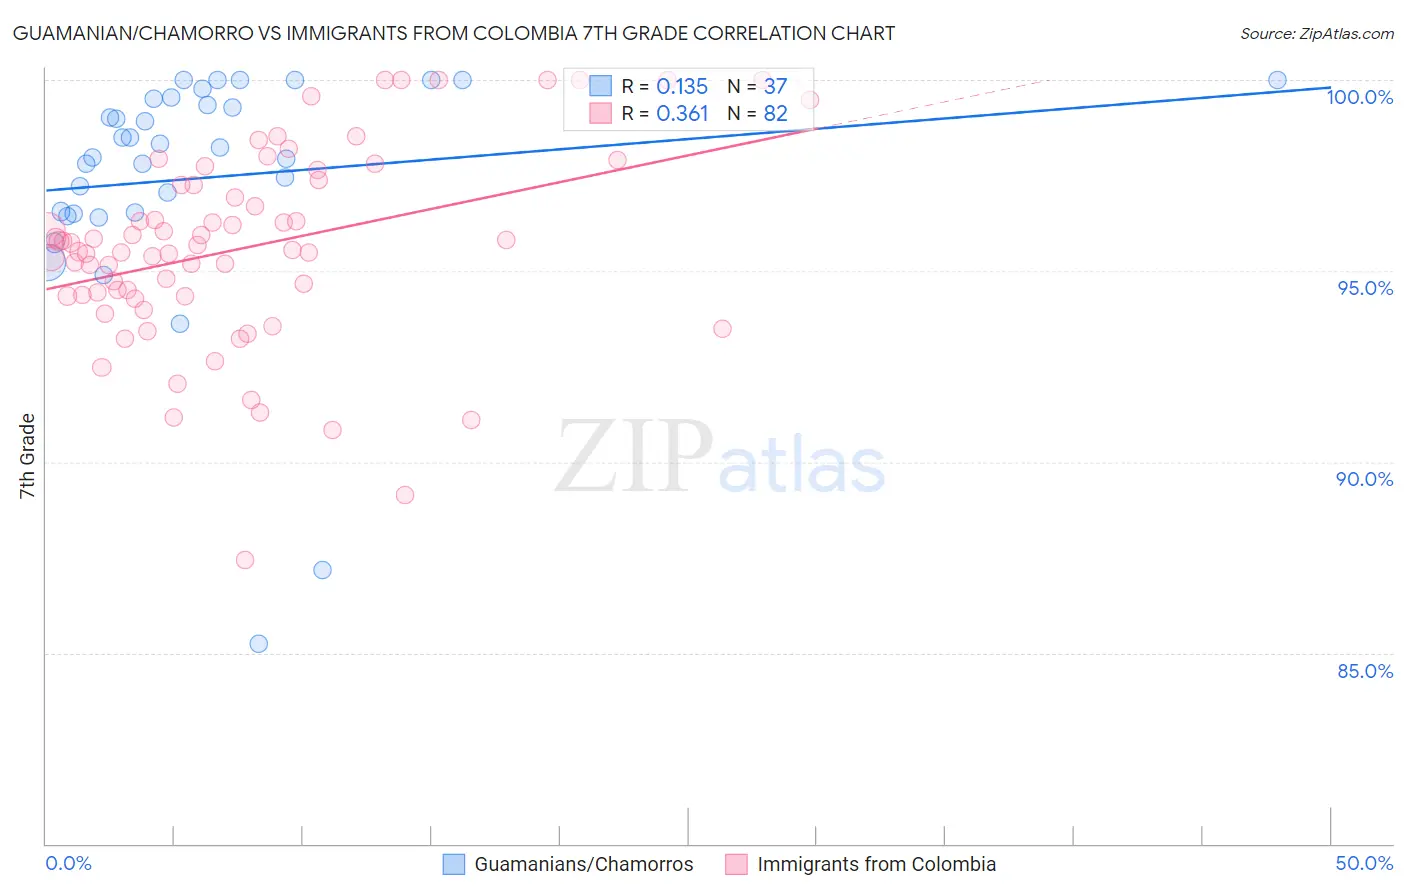
Guamanian/Chamorro vs Immigrants from Colombia 7th Grade Correlation Chart
The statistical analysis conducted on geographies consisting of 221,965,618 people shows a poor positive correlation between the proportion of Guamanians/Chamorros and percentage of population with at least 7th grade education in the United States with a correlation coefficient (R) of 0.135 and weighted average of 95.9%. Similarly, the statistical analysis conducted on geographies consisting of 378,598,469 people shows a mild positive correlation between the proportion of Immigrants from Colombia and percentage of population with at least 7th grade education in the United States with a correlation coefficient (R) of 0.361 and weighted average of 95.1%, a difference of 0.78%.
7th Grade Correlation Summary
| Measurement | Guamanian/Chamorro | Immigrants from Colombia |
| Minimum | 85.2% | 87.4% |
| Maximum | 100.0% | 100.0% |
| Range | 14.8% | 12.6% |
| Mean | 97.4% | 95.6% |
| Median | 98.2% | 95.6% |
| Interquartile 25% (IQ1) | 96.5% | 94.3% |
| Interquartile 75% (IQ3) | 99.5% | 97.3% |
| Interquartile Range (IQR) | 3.0% | 2.9% |
| Standard Deviation (Sample) | 3.2% | 2.6% |
| Standard Deviation (Population) | 3.1% | 2.5% |
Similar Demographics by 7th Grade
Demographics Similar to Guamanians/Chamorros by 7th Grade
In terms of 7th grade, the demographic groups most similar to Guamanians/Chamorros are Argentinean (95.9%, a difference of 0.0%), Paraguayan (95.9%, a difference of 0.010%), Immigrants from Argentina (95.9%, a difference of 0.010%), Immigrants from Northern Africa (95.8%, a difference of 0.020%), and Comanche (95.8%, a difference of 0.020%).
| Demographics | Rating | Rank | 7th Grade |
| Panamanians | 32.3 /100 | #192 | Fair 95.9% |
| Immigrants | Bahamas | 30.8 /100 | #193 | Fair 95.9% |
| Immigrants | Nepal | 30.0 /100 | #194 | Fair 95.9% |
| Sudanese | 28.1 /100 | #195 | Fair 95.9% |
| Apache | 27.6 /100 | #196 | Fair 95.9% |
| Immigrants | Zaire | 26.7 /100 | #197 | Fair 95.9% |
| Paraguayans | 24.8 /100 | #198 | Fair 95.9% |
| Guamanians/Chamorros | 23.5 /100 | #199 | Fair 95.9% |
| Argentineans | 23.2 /100 | #200 | Fair 95.9% |
| Immigrants | Argentina | 21.9 /100 | #201 | Fair 95.9% |
| Immigrants | Northern Africa | 21.4 /100 | #202 | Fair 95.8% |
| Comanche | 21.1 /100 | #203 | Fair 95.8% |
| Assyrians/Chaldeans/Syriacs | 20.5 /100 | #204 | Fair 95.8% |
| Moroccans | 18.9 /100 | #205 | Poor 95.8% |
| Africans | 17.6 /100 | #206 | Poor 95.8% |
Demographics Similar to Immigrants from Colombia by 7th Grade
In terms of 7th grade, the demographic groups most similar to Immigrants from Colombia are Peruvian (95.1%, a difference of 0.010%), Immigrants from Uzbekistan (95.1%, a difference of 0.010%), Immigrants from Western Africa (95.1%, a difference of 0.010%), Houma (95.1%, a difference of 0.020%), and Immigrants from South America (95.1%, a difference of 0.020%).
| Demographics | Rating | Rank | 7th Grade |
| Immigrants | Hong Kong | 0.3 /100 | #268 | Tragic 95.2% |
| Trinidadians and Tobagonians | 0.3 /100 | #269 | Tragic 95.2% |
| Houma | 0.2 /100 | #270 | Tragic 95.1% |
| Immigrants | South America | 0.2 /100 | #271 | Tragic 95.1% |
| Peruvians | 0.2 /100 | #272 | Tragic 95.1% |
| Immigrants | Uzbekistan | 0.2 /100 | #273 | Tragic 95.1% |
| Immigrants | Western Africa | 0.2 /100 | #274 | Tragic 95.1% |
| Immigrants | Colombia | 0.2 /100 | #275 | Tragic 95.1% |
| Immigrants | Thailand | 0.2 /100 | #276 | Tragic 95.1% |
| Immigrants | Afghanistan | 0.2 /100 | #277 | Tragic 95.1% |
| Immigrants | Trinidad and Tobago | 0.1 /100 | #278 | Tragic 95.1% |
| Barbadians | 0.1 /100 | #279 | Tragic 95.1% |
| Immigrants | St. Vincent and the Grenadines | 0.1 /100 | #280 | Tragic 95.0% |
| Tohono O'odham | 0.1 /100 | #281 | Tragic 95.0% |
| Immigrants | Bolivia | 0.1 /100 | #282 | Tragic 95.0% |