Barbadian vs Immigrants from Colombia 7th Grade
COMPARE
Barbadian
Immigrants from Colombia
7th Grade
7th Grade Comparison
Barbadians
Immigrants from Colombia
95.1%
7TH GRADE
0.1/ 100
METRIC RATING
279th/ 347
METRIC RANK
95.1%
7TH GRADE
0.2/ 100
METRIC RATING
275th/ 347
METRIC RANK
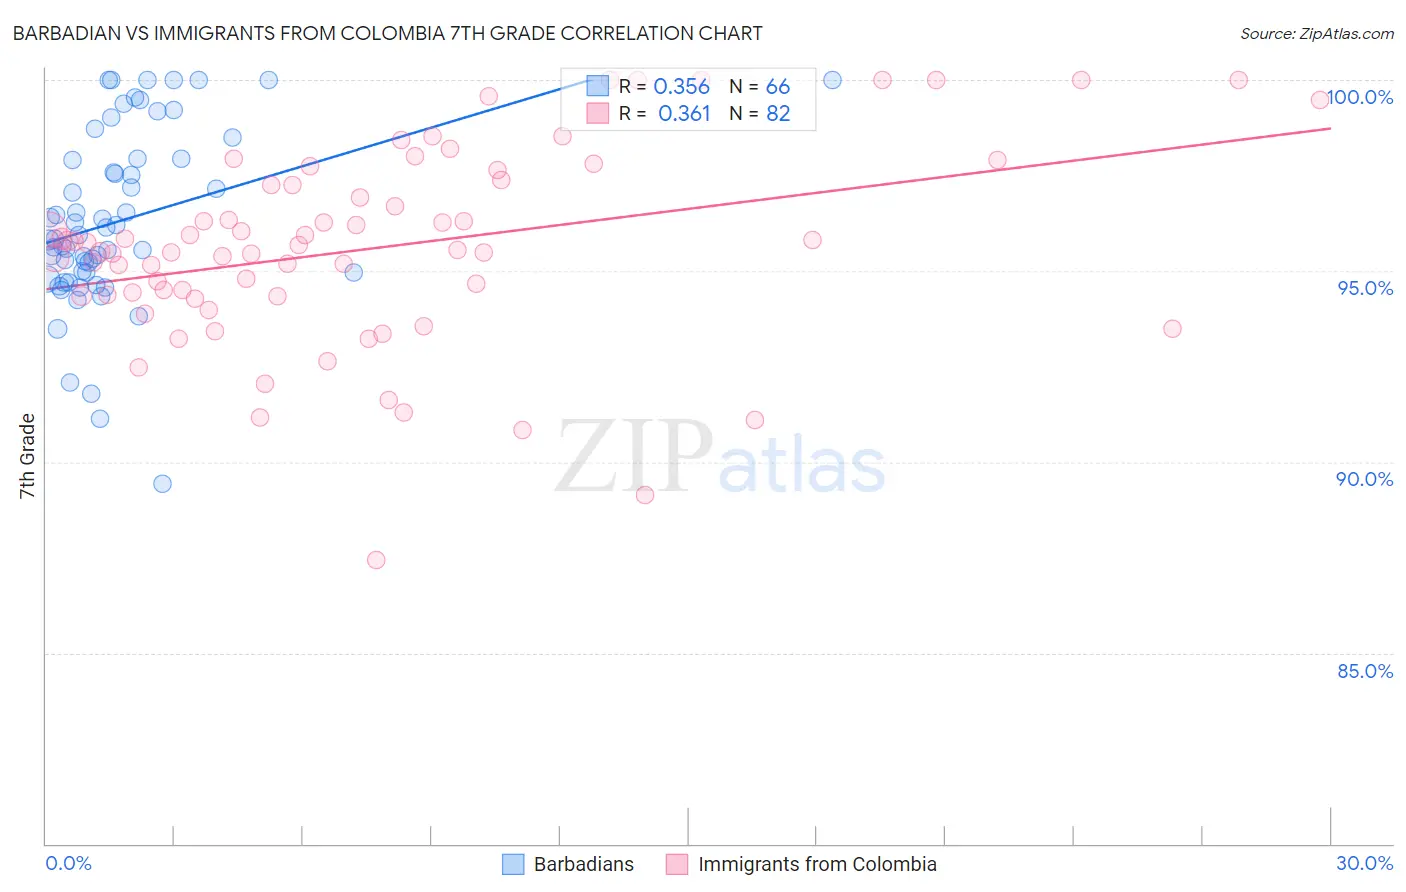
Barbadian vs Immigrants from Colombia 7th Grade Correlation Chart
The statistical analysis conducted on geographies consisting of 141,299,217 people shows a mild positive correlation between the proportion of Barbadians and percentage of population with at least 7th grade education in the United States with a correlation coefficient (R) of 0.356 and weighted average of 95.1%. Similarly, the statistical analysis conducted on geographies consisting of 378,598,469 people shows a mild positive correlation between the proportion of Immigrants from Colombia and percentage of population with at least 7th grade education in the United States with a correlation coefficient (R) of 0.361 and weighted average of 95.1%, a difference of 0.080%.
7th Grade Correlation Summary
| Measurement | Barbadian | Immigrants from Colombia |
| Minimum | 89.4% | 87.4% |
| Maximum | 100.0% | 100.0% |
| Range | 10.6% | 12.6% |
| Mean | 96.3% | 95.6% |
| Median | 95.9% | 95.6% |
| Interquartile 25% (IQ1) | 95.0% | 94.3% |
| Interquartile 75% (IQ3) | 97.9% | 97.3% |
| Interquartile Range (IQR) | 3.0% | 2.9% |
| Standard Deviation (Sample) | 2.3% | 2.6% |
| Standard Deviation (Population) | 2.3% | 2.5% |
Demographics Similar to Barbadians and Immigrants from Colombia by 7th Grade
In terms of 7th grade, the demographic groups most similar to Barbadians are Immigrants from Trinidad and Tobago (95.1%, a difference of 0.010%), Immigrants from St. Vincent and the Grenadines (95.0%, a difference of 0.030%), Tohono O'odham (95.0%, a difference of 0.030%), Immigrants from Afghanistan (95.1%, a difference of 0.040%), and Immigrants from Bolivia (95.0%, a difference of 0.040%). Similarly, the demographic groups most similar to Immigrants from Colombia are Peruvian (95.1%, a difference of 0.010%), Immigrants from Uzbekistan (95.1%, a difference of 0.010%), Immigrants from Western Africa (95.1%, a difference of 0.010%), Houma (95.1%, a difference of 0.020%), and Immigrants from South America (95.1%, a difference of 0.020%).
| Demographics | Rating | Rank | 7th Grade |
| Yuman | 0.3 /100 | #267 | Tragic 95.2% |
| Immigrants | Hong Kong | 0.3 /100 | #268 | Tragic 95.2% |
| Trinidadians and Tobagonians | 0.3 /100 | #269 | Tragic 95.2% |
| Houma | 0.2 /100 | #270 | Tragic 95.1% |
| Immigrants | South America | 0.2 /100 | #271 | Tragic 95.1% |
| Peruvians | 0.2 /100 | #272 | Tragic 95.1% |
| Immigrants | Uzbekistan | 0.2 /100 | #273 | Tragic 95.1% |
| Immigrants | Western Africa | 0.2 /100 | #274 | Tragic 95.1% |
| Immigrants | Colombia | 0.2 /100 | #275 | Tragic 95.1% |
| Immigrants | Thailand | 0.2 /100 | #276 | Tragic 95.1% |
| Immigrants | Afghanistan | 0.2 /100 | #277 | Tragic 95.1% |
| Immigrants | Trinidad and Tobago | 0.1 /100 | #278 | Tragic 95.1% |
| Barbadians | 0.1 /100 | #279 | Tragic 95.1% |
| Immigrants | St. Vincent and the Grenadines | 0.1 /100 | #280 | Tragic 95.0% |
| Tohono O'odham | 0.1 /100 | #281 | Tragic 95.0% |
| Immigrants | Bolivia | 0.1 /100 | #282 | Tragic 95.0% |
| Immigrants | Barbados | 0.1 /100 | #283 | Tragic 95.0% |
| Armenians | 0.1 /100 | #284 | Tragic 95.0% |
| Immigrants | Eritrea | 0.1 /100 | #285 | Tragic 94.9% |
| Immigrants | Philippines | 0.0 /100 | #286 | Tragic 94.9% |
| Immigrants | Peru | 0.0 /100 | #287 | Tragic 94.9% |