Colombian vs Immigrants from Cambodia 7th Grade
COMPARE
Colombian
Immigrants from Cambodia
7th Grade
7th Grade Comparison
Colombians
Immigrants from Cambodia
95.3%
7TH GRADE
0.8/ 100
METRIC RATING
254th/ 347
METRIC RANK
93.7%
7TH GRADE
0.0/ 100
METRIC RATING
319th/ 347
METRIC RANK
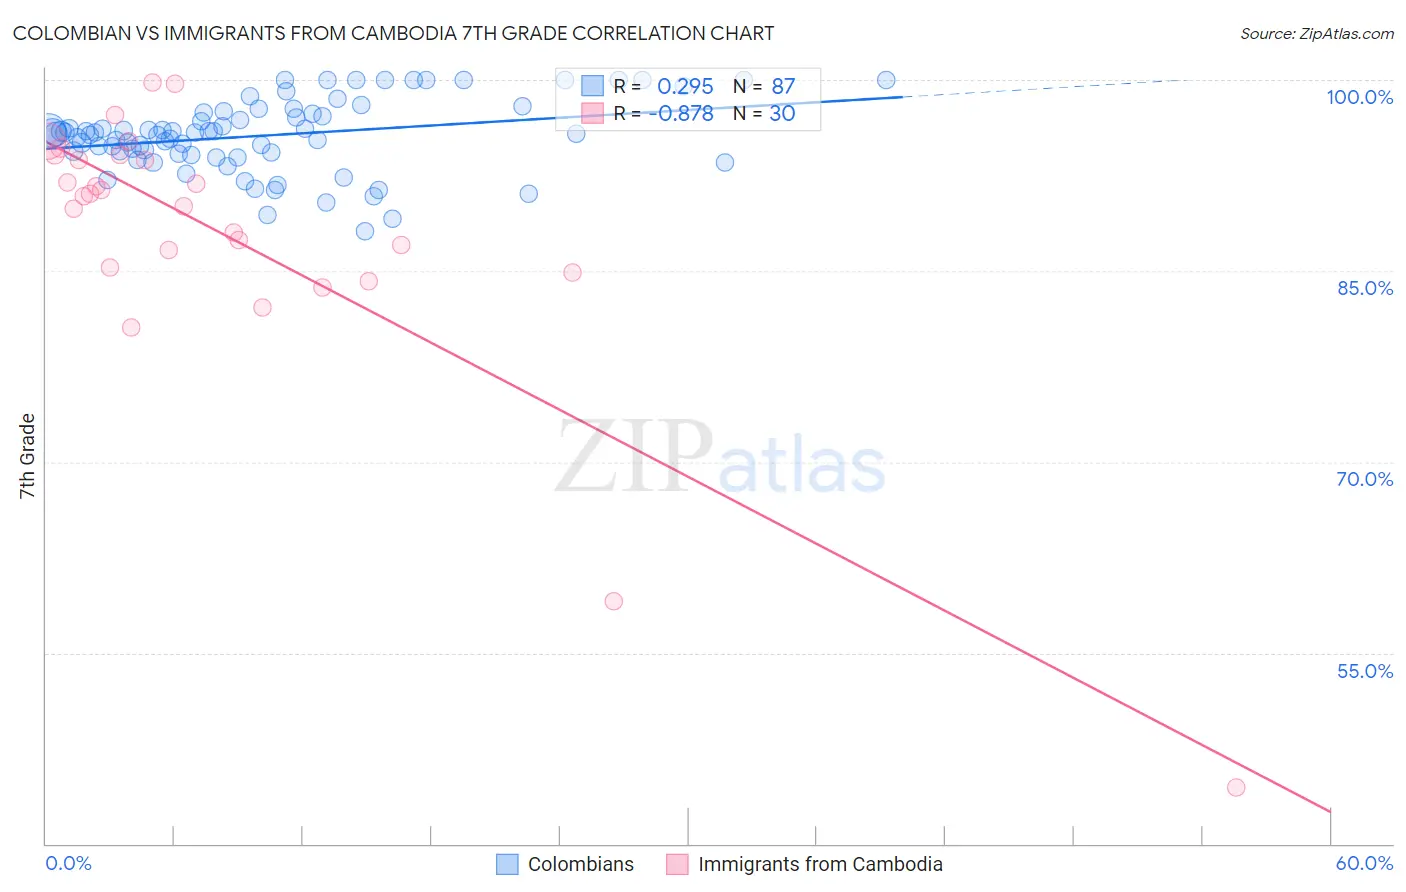
Colombian vs Immigrants from Cambodia 7th Grade Correlation Chart
The statistical analysis conducted on geographies consisting of 419,655,116 people shows a weak positive correlation between the proportion of Colombians and percentage of population with at least 7th grade education in the United States with a correlation coefficient (R) of 0.295 and weighted average of 95.3%. Similarly, the statistical analysis conducted on geographies consisting of 205,153,442 people shows a very strong negative correlation between the proportion of Immigrants from Cambodia and percentage of population with at least 7th grade education in the United States with a correlation coefficient (R) of -0.878 and weighted average of 93.7%, a difference of 1.7%.
7th Grade Correlation Summary
| Measurement | Colombian | Immigrants from Cambodia |
| Minimum | 88.1% | 44.4% |
| Maximum | 100.0% | 99.8% |
| Range | 11.9% | 55.4% |
| Mean | 95.6% | 88.0% |
| Median | 95.8% | 90.9% |
| Interquartile 25% (IQ1) | 94.2% | 85.3% |
| Interquartile 75% (IQ3) | 97.5% | 94.1% |
| Interquartile Range (IQR) | 3.3% | 8.8% |
| Standard Deviation (Sample) | 2.8% | 11.2% |
| Standard Deviation (Population) | 2.8% | 11.0% |
Similar Demographics by 7th Grade
Demographics Similar to Colombians by 7th Grade
In terms of 7th grade, the demographic groups most similar to Colombians are Somali (95.3%, a difference of 0.010%), Korean (95.3%, a difference of 0.010%), Immigrants from Cameroon (95.4%, a difference of 0.020%), Immigrants from Jamaica (95.4%, a difference of 0.020%), and Immigrants from Ethiopia (95.3%, a difference of 0.020%).
| Demographics | Rating | Rank | 7th Grade |
| Tongans | 1.3 /100 | #247 | Tragic 95.4% |
| Paiute | 1.2 /100 | #248 | Tragic 95.4% |
| Bolivians | 1.1 /100 | #249 | Tragic 95.4% |
| Immigrants | Cameroon | 0.9 /100 | #250 | Tragic 95.4% |
| Immigrants | Jamaica | 0.9 /100 | #251 | Tragic 95.4% |
| Immigrants | Ethiopia | 0.9 /100 | #252 | Tragic 95.3% |
| Somalis | 0.9 /100 | #253 | Tragic 95.3% |
| Colombians | 0.8 /100 | #254 | Tragic 95.3% |
| Koreans | 0.8 /100 | #255 | Tragic 95.3% |
| Immigrants | China | 0.7 /100 | #256 | Tragic 95.3% |
| Immigrants | Congo | 0.7 /100 | #257 | Tragic 95.3% |
| Ghanaians | 0.7 /100 | #258 | Tragic 95.3% |
| Immigrants | Costa Rica | 0.6 /100 | #259 | Tragic 95.3% |
| Afghans | 0.5 /100 | #260 | Tragic 95.3% |
| South Americans | 0.5 /100 | #261 | Tragic 95.2% |
Demographics Similar to Immigrants from Cambodia by 7th Grade
In terms of 7th grade, the demographic groups most similar to Immigrants from Cambodia are Immigrants from Ecuador (93.7%, a difference of 0.030%), Immigrants from Cuba (93.8%, a difference of 0.11%), Immigrants from Fiji (93.5%, a difference of 0.17%), Immigrants from Vietnam (93.9%, a difference of 0.20%), and Belizean (93.5%, a difference of 0.21%).
| Demographics | Rating | Rank | 7th Grade |
| Immigrants | Immigrants | 0.0 /100 | #312 | Tragic 94.0% |
| Immigrants | Bangladesh | 0.0 /100 | #313 | Tragic 94.0% |
| Japanese | 0.0 /100 | #314 | Tragic 94.0% |
| Vietnamese | 0.0 /100 | #315 | Tragic 93.9% |
| Immigrants | Vietnam | 0.0 /100 | #316 | Tragic 93.9% |
| Immigrants | Cuba | 0.0 /100 | #317 | Tragic 93.8% |
| Immigrants | Ecuador | 0.0 /100 | #318 | Tragic 93.7% |
| Immigrants | Cambodia | 0.0 /100 | #319 | Tragic 93.7% |
| Immigrants | Fiji | 0.0 /100 | #320 | Tragic 93.5% |
| Belizeans | 0.0 /100 | #321 | Tragic 93.5% |
| Nicaraguans | 0.0 /100 | #322 | Tragic 93.5% |
| Immigrants | Belize | 0.0 /100 | #323 | Tragic 93.4% |
| Dominicans | 0.0 /100 | #324 | Tragic 93.3% |
| Central American Indians | 0.0 /100 | #325 | Tragic 93.3% |
| Nepalese | 0.0 /100 | #326 | Tragic 93.2% |