Immigrants from Iran vs Immigrants from Barbados Doctorate Degree
COMPARE
Immigrants from Iran
Immigrants from Barbados
Doctorate Degree
Doctorate Degree Comparison
Immigrants from Iran
Immigrants from Barbados
3.0%
DOCTORATE DEGREE
100.0/ 100
METRIC RATING
9th/ 347
METRIC RANK
1.5%
DOCTORATE DEGREE
0.4/ 100
METRIC RATING
272nd/ 347
METRIC RANK
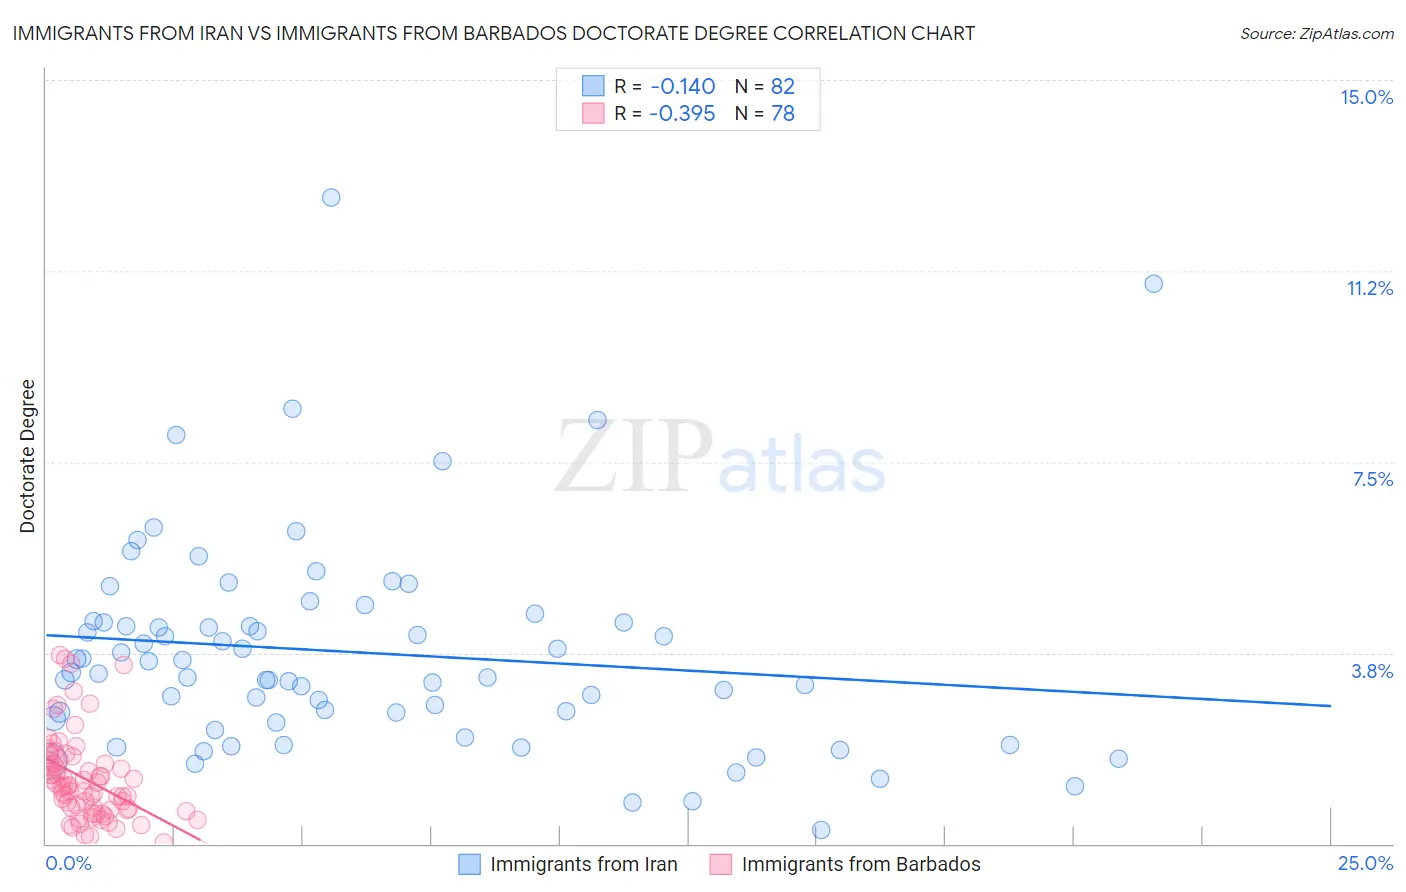
Immigrants from Iran vs Immigrants from Barbados Doctorate Degree Correlation Chart
The statistical analysis conducted on geographies consisting of 279,321,520 people shows a poor negative correlation between the proportion of Immigrants from Iran and percentage of population with at least doctorate degree education in the United States with a correlation coefficient (R) of -0.140 and weighted average of 3.0%. Similarly, the statistical analysis conducted on geographies consisting of 112,445,982 people shows a mild negative correlation between the proportion of Immigrants from Barbados and percentage of population with at least doctorate degree education in the United States with a correlation coefficient (R) of -0.395 and weighted average of 1.5%, a difference of 105.3%.
Doctorate Degree Correlation Summary
| Measurement | Immigrants from Iran | Immigrants from Barbados |
| Minimum | 0.26% | 0.017% |
| Maximum | 12.7% | 3.7% |
| Range | 12.4% | 3.7% |
| Mean | 3.8% | 1.3% |
| Median | 3.4% | 1.1% |
| Interquartile 25% (IQ1) | 2.5% | 0.66% |
| Interquartile 75% (IQ3) | 4.4% | 1.6% |
| Interquartile Range (IQR) | 1.9% | 0.96% |
| Standard Deviation (Sample) | 2.1% | 0.84% |
| Standard Deviation (Population) | 2.1% | 0.83% |
Similar Demographics by Doctorate Degree
Demographics Similar to Immigrants from Iran by Doctorate Degree
In terms of doctorate degree, the demographic groups most similar to Immigrants from Iran are Immigrants from Israel (3.0%, a difference of 0.67%), Immigrants from China (3.1%, a difference of 2.0%), Immigrants from Switzerland (3.1%, a difference of 2.1%), Immigrants from Eastern Asia (3.0%, a difference of 2.1%), and Iranian (3.1%, a difference of 4.0%).
| Demographics | Rating | Rank | Doctorate Degree |
| Filipinos | 100.0 /100 | #2 | Exceptional 3.4% |
| Okinawans | 100.0 /100 | #3 | Exceptional 3.3% |
| Immigrants | Taiwan | 100.0 /100 | #4 | Exceptional 3.2% |
| Iranians | 100.0 /100 | #5 | Exceptional 3.1% |
| Immigrants | Switzerland | 100.0 /100 | #6 | Exceptional 3.1% |
| Immigrants | China | 100.0 /100 | #7 | Exceptional 3.1% |
| Immigrants | Israel | 100.0 /100 | #8 | Exceptional 3.0% |
| Immigrants | Iran | 100.0 /100 | #9 | Exceptional 3.0% |
| Immigrants | Eastern Asia | 100.0 /100 | #10 | Exceptional 3.0% |
| Indians (Asian) | 100.0 /100 | #11 | Exceptional 2.9% |
| Immigrants | Belgium | 100.0 /100 | #12 | Exceptional 2.9% |
| Immigrants | Sweden | 100.0 /100 | #13 | Exceptional 2.9% |
| Immigrants | France | 100.0 /100 | #14 | Exceptional 2.9% |
| Immigrants | India | 100.0 /100 | #15 | Exceptional 2.8% |
| Eastern Europeans | 100.0 /100 | #16 | Exceptional 2.8% |
Demographics Similar to Immigrants from Barbados by Doctorate Degree
In terms of doctorate degree, the demographic groups most similar to Immigrants from Barbados are Immigrants from Trinidad and Tobago (1.5%, a difference of 0.090%), Sioux (1.5%, a difference of 0.11%), Yaqui (1.5%, a difference of 0.13%), Salvadoran (1.5%, a difference of 0.16%), and Crow (1.5%, a difference of 0.19%).
| Demographics | Rating | Rank | Doctorate Degree |
| Nicaraguans | 0.6 /100 | #265 | Tragic 1.5% |
| Immigrants | Liberia | 0.5 /100 | #266 | Tragic 1.5% |
| Kiowa | 0.5 /100 | #267 | Tragic 1.5% |
| U.S. Virgin Islanders | 0.5 /100 | #268 | Tragic 1.5% |
| Crow | 0.5 /100 | #269 | Tragic 1.5% |
| Salvadorans | 0.5 /100 | #270 | Tragic 1.5% |
| Immigrants | Trinidad and Tobago | 0.5 /100 | #271 | Tragic 1.5% |
| Immigrants | Barbados | 0.4 /100 | #272 | Tragic 1.5% |
| Sioux | 0.4 /100 | #273 | Tragic 1.5% |
| Yaqui | 0.4 /100 | #274 | Tragic 1.5% |
| Aleuts | 0.4 /100 | #275 | Tragic 1.5% |
| Paiute | 0.4 /100 | #276 | Tragic 1.5% |
| Bahamians | 0.4 /100 | #277 | Tragic 1.5% |
| Hawaiians | 0.4 /100 | #278 | Tragic 1.5% |
| Marshallese | 0.4 /100 | #279 | Tragic 1.5% |