Choctaw vs Immigrants from South Eastern Asia Bachelor's Degree
COMPARE
Choctaw
Immigrants from South Eastern Asia
Bachelor's Degree
Bachelor's Degree Comparison
Choctaw
Immigrants from South Eastern Asia
29.4%
BACHELOR'S DEGREE
0.0/ 100
METRIC RATING
311th/ 347
METRIC RANK
36.8%
BACHELOR'S DEGREE
25.4/ 100
METRIC RATING
201st/ 347
METRIC RANK
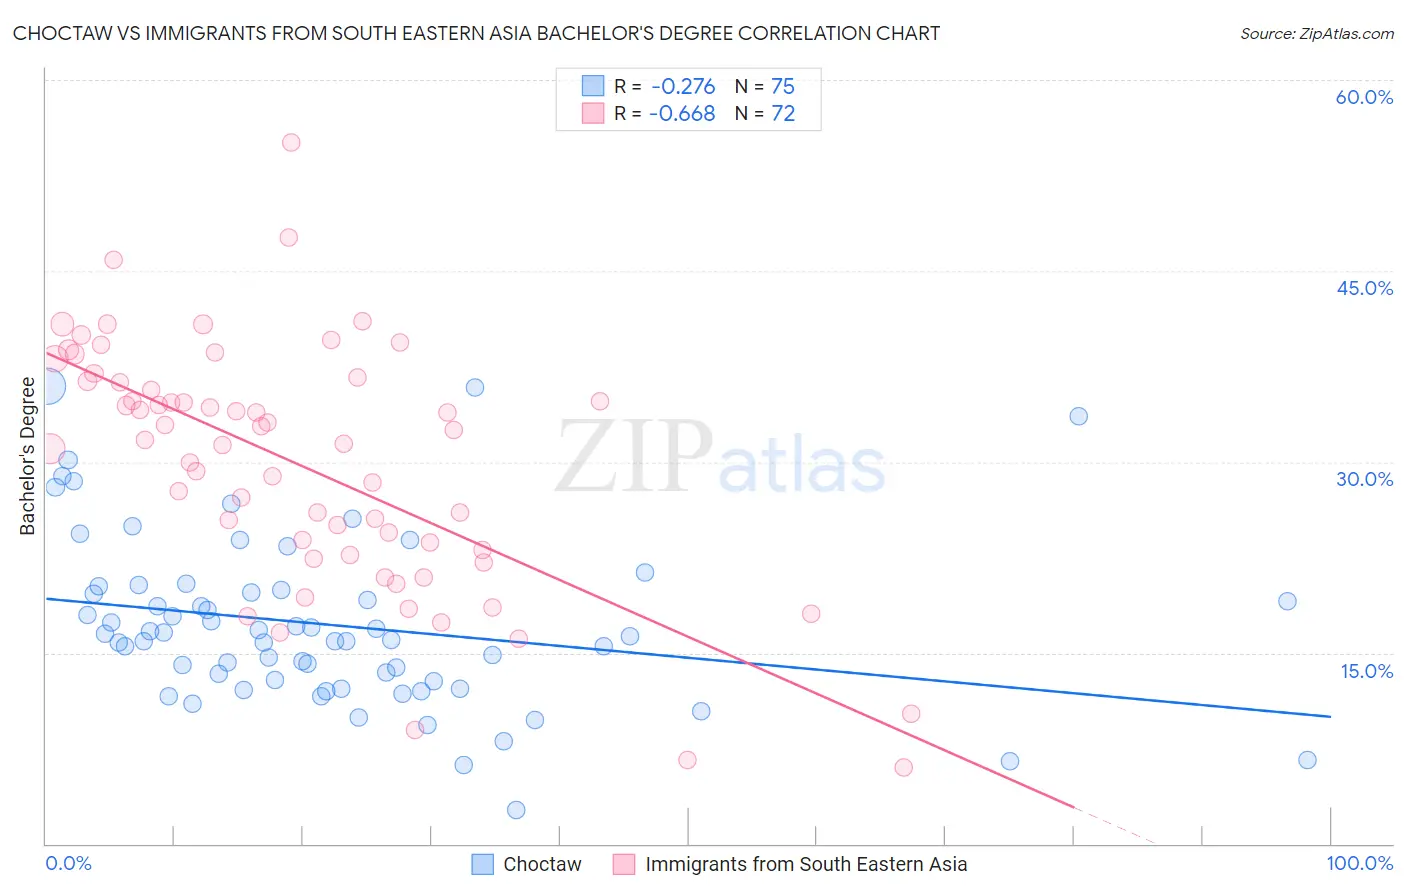
Choctaw vs Immigrants from South Eastern Asia Bachelor's Degree Correlation Chart
The statistical analysis conducted on geographies consisting of 269,719,391 people shows a weak negative correlation between the proportion of Choctaw and percentage of population with at least bachelor's degree education in the United States with a correlation coefficient (R) of -0.276 and weighted average of 29.4%. Similarly, the statistical analysis conducted on geographies consisting of 512,639,953 people shows a significant negative correlation between the proportion of Immigrants from South Eastern Asia and percentage of population with at least bachelor's degree education in the United States with a correlation coefficient (R) of -0.668 and weighted average of 36.8%, a difference of 25.2%.
Bachelor's Degree Correlation Summary
| Measurement | Choctaw | Immigrants from South Eastern Asia |
| Minimum | 2.7% | 6.0% |
| Maximum | 35.9% | 55.1% |
| Range | 33.3% | 49.1% |
| Mean | 17.2% | 29.7% |
| Median | 16.3% | 31.6% |
| Interquartile 25% (IQ1) | 12.8% | 22.9% |
| Interquartile 75% (IQ3) | 20.0% | 36.3% |
| Interquartile Range (IQR) | 7.2% | 13.4% |
| Standard Deviation (Sample) | 6.6% | 9.7% |
| Standard Deviation (Population) | 6.6% | 9.6% |
Similar Demographics by Bachelor's Degree
Demographics Similar to Choctaw by Bachelor's Degree
In terms of bachelor's degree, the demographic groups most similar to Choctaw are Seminole (29.4%, a difference of 0.060%), Cheyenne (29.4%, a difference of 0.070%), Alaska Native (29.4%, a difference of 0.24%), Shoshone (29.3%, a difference of 0.53%), and Hispanic or Latino (29.6%, a difference of 0.54%).
| Demographics | Rating | Rank | Bachelor's Degree |
| Cherokee | 0.0 /100 | #304 | Tragic 30.2% |
| Immigrants | Latin America | 0.0 /100 | #305 | Tragic 30.1% |
| Immigrants | Yemen | 0.0 /100 | #306 | Tragic 29.9% |
| Nepalese | 0.0 /100 | #307 | Tragic 29.9% |
| Cajuns | 0.0 /100 | #308 | Tragic 29.6% |
| Hispanics or Latinos | 0.0 /100 | #309 | Tragic 29.6% |
| Cheyenne | 0.0 /100 | #310 | Tragic 29.4% |
| Choctaw | 0.0 /100 | #311 | Tragic 29.4% |
| Seminole | 0.0 /100 | #312 | Tragic 29.4% |
| Alaska Natives | 0.0 /100 | #313 | Tragic 29.4% |
| Shoshone | 0.0 /100 | #314 | Tragic 29.3% |
| Immigrants | Cabo Verde | 0.0 /100 | #315 | Tragic 29.2% |
| Sioux | 0.0 /100 | #316 | Tragic 29.1% |
| Colville | 0.0 /100 | #317 | Tragic 29.0% |
| Yaqui | 0.0 /100 | #318 | Tragic 29.0% |
Demographics Similar to Immigrants from South Eastern Asia by Bachelor's Degree
In terms of bachelor's degree, the demographic groups most similar to Immigrants from South Eastern Asia are Immigrants from Zaire (36.8%, a difference of 0.010%), Immigrants from Costa Rica (36.9%, a difference of 0.26%), Immigrants from Ghana (36.9%, a difference of 0.26%), Immigrants from Nigeria (36.7%, a difference of 0.31%), and Immigrants (36.7%, a difference of 0.35%).
| Demographics | Rating | Rank | Bachelor's Degree |
| Belgians | 29.9 /100 | #194 | Fair 37.0% |
| Koreans | 29.8 /100 | #195 | Fair 37.0% |
| Celtics | 29.5 /100 | #196 | Fair 37.0% |
| Czechoslovakians | 29.2 /100 | #197 | Fair 37.0% |
| Welsh | 29.1 /100 | #198 | Fair 37.0% |
| Immigrants | Costa Rica | 27.4 /100 | #199 | Fair 36.9% |
| Immigrants | Ghana | 27.4 /100 | #200 | Fair 36.9% |
| Immigrants | South Eastern Asia | 25.4 /100 | #201 | Fair 36.8% |
| Immigrants | Zaire | 25.3 /100 | #202 | Fair 36.8% |
| Immigrants | Nigeria | 23.1 /100 | #203 | Fair 36.7% |
| Immigrants | Immigrants | 22.8 /100 | #204 | Fair 36.7% |
| Finns | 22.2 /100 | #205 | Fair 36.7% |
| Spaniards | 21.2 /100 | #206 | Fair 36.6% |
| Immigrants | Middle Africa | 20.6 /100 | #207 | Fair 36.6% |
| Immigrants | Thailand | 19.4 /100 | #208 | Poor 36.5% |