Immigrants from Barbados vs Immigrants from South Eastern Asia High School Diploma
COMPARE
Immigrants from Barbados
Immigrants from South Eastern Asia
High School Diploma
High School Diploma Comparison
Immigrants from Barbados
Immigrants from South Eastern Asia
86.4%
HIGH SCHOOL DIPLOMA
0.0/ 100
METRIC RATING
283rd/ 347
METRIC RANK
87.2%
HIGH SCHOOL DIPLOMA
0.3/ 100
METRIC RATING
263rd/ 347
METRIC RANK
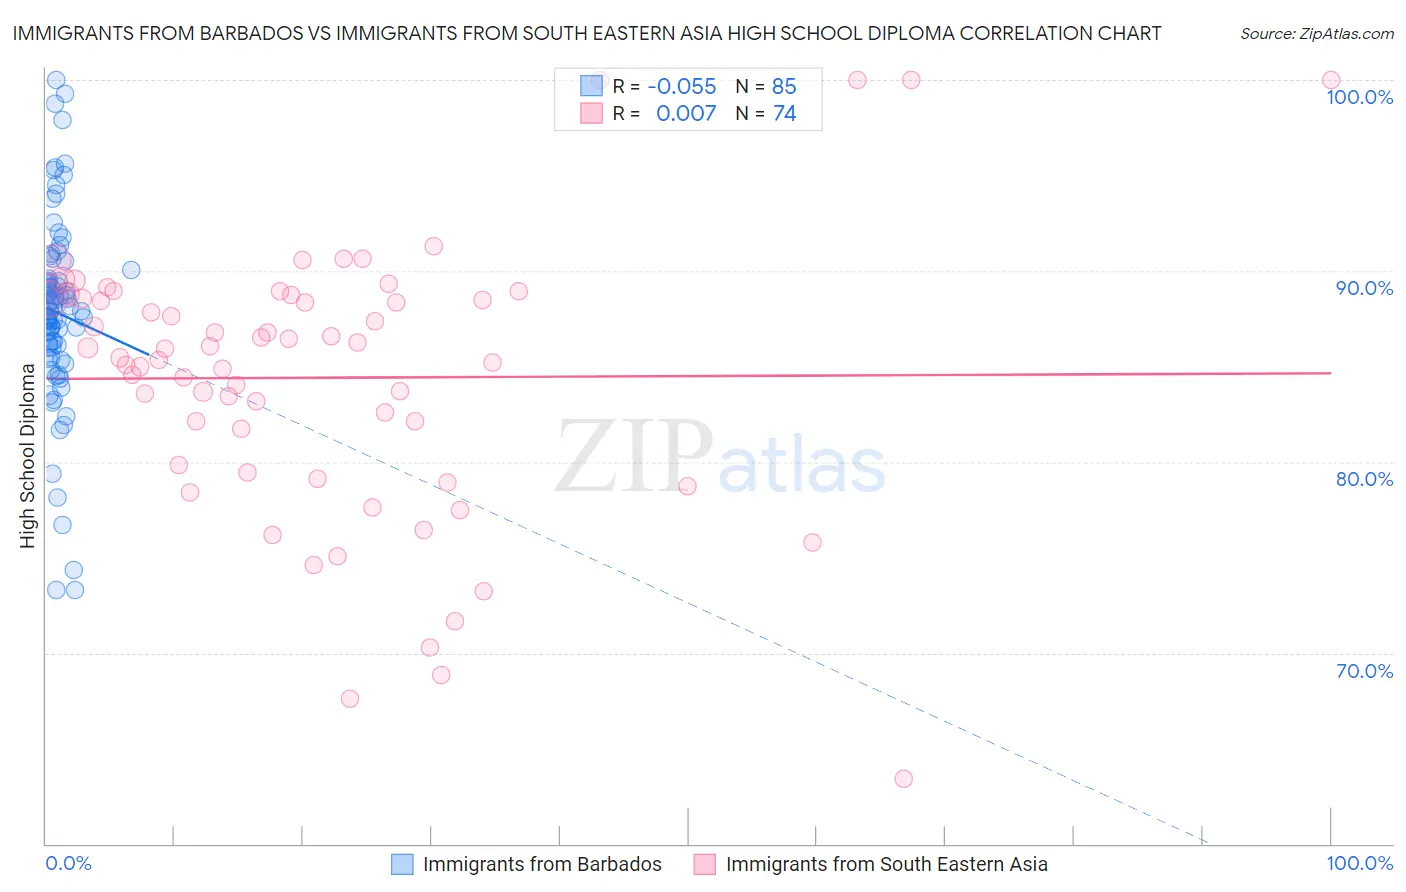
Immigrants from Barbados vs Immigrants from South Eastern Asia High School Diploma Correlation Chart
The statistical analysis conducted on geographies consisting of 112,782,130 people shows a slight negative correlation between the proportion of Immigrants from Barbados and percentage of population with at least high school diploma education in the United States with a correlation coefficient (R) of -0.055 and weighted average of 86.4%. Similarly, the statistical analysis conducted on geographies consisting of 512,708,901 people shows no correlation between the proportion of Immigrants from South Eastern Asia and percentage of population with at least high school diploma education in the United States with a correlation coefficient (R) of 0.007 and weighted average of 87.2%, a difference of 0.94%.
High School Diploma Correlation Summary
| Measurement | Immigrants from Barbados | Immigrants from South Eastern Asia |
| Minimum | 73.3% | 63.4% |
| Maximum | 100.0% | 100.0% |
| Range | 26.7% | 36.6% |
| Mean | 87.8% | 84.4% |
| Median | 87.9% | 85.7% |
| Interquartile 25% (IQ1) | 85.7% | 79.9% |
| Interquartile 75% (IQ3) | 89.8% | 88.6% |
| Interquartile Range (IQR) | 4.1% | 8.7% |
| Standard Deviation (Sample) | 5.1% | 7.1% |
| Standard Deviation (Population) | 5.0% | 7.1% |
Demographics Similar to Immigrants from Barbados and Immigrants from South Eastern Asia by High School Diploma
In terms of high school diploma, the demographic groups most similar to Immigrants from Barbados are Dutch West Indian (86.5%, a difference of 0.060%), Indonesian (86.5%, a difference of 0.10%), Pueblo (86.5%, a difference of 0.15%), Immigrants from Laos (86.6%, a difference of 0.17%), and Hopi (86.6%, a difference of 0.21%). Similarly, the demographic groups most similar to Immigrants from South Eastern Asia are Jamaican (87.2%, a difference of 0.020%), U.S. Virgin Islander (87.1%, a difference of 0.16%), Immigrants from Congo (87.0%, a difference of 0.21%), Black/African American (87.0%, a difference of 0.22%), and Pennsylvania German (87.0%, a difference of 0.25%).
| Demographics | Rating | Rank | High School Diploma |
| Immigrants | South Eastern Asia | 0.3 /100 | #263 | Tragic 87.2% |
| Jamaicans | 0.3 /100 | #264 | Tragic 87.2% |
| U.S. Virgin Islanders | 0.2 /100 | #265 | Tragic 87.1% |
| Immigrants | Congo | 0.2 /100 | #266 | Tragic 87.0% |
| Blacks/African Americans | 0.2 /100 | #267 | Tragic 87.0% |
| Pennsylvania Germans | 0.2 /100 | #268 | Tragic 87.0% |
| Sri Lankans | 0.2 /100 | #269 | Tragic 87.0% |
| Malaysians | 0.2 /100 | #270 | Tragic 87.0% |
| West Indians | 0.1 /100 | #271 | Tragic 86.9% |
| Trinidadians and Tobagonians | 0.1 /100 | #272 | Tragic 86.9% |
| Immigrants | Jamaica | 0.1 /100 | #273 | Tragic 86.9% |
| Bangladeshis | 0.1 /100 | #274 | Tragic 86.9% |
| Immigrants | Trinidad and Tobago | 0.1 /100 | #275 | Tragic 86.8% |
| Immigrants | Burma/Myanmar | 0.1 /100 | #276 | Tragic 86.7% |
| Barbadians | 0.1 /100 | #277 | Tragic 86.7% |
| Hopi | 0.1 /100 | #278 | Tragic 86.6% |
| Immigrants | Laos | 0.0 /100 | #279 | Tragic 86.6% |
| Pueblo | 0.0 /100 | #280 | Tragic 86.5% |
| Indonesians | 0.0 /100 | #281 | Tragic 86.5% |
| Dutch West Indians | 0.0 /100 | #282 | Tragic 86.5% |
| Immigrants | Barbados | 0.0 /100 | #283 | Tragic 86.4% |