Chippewa vs Immigrants from Korea 8th Grade
COMPARE
Chippewa
Immigrants from Korea
8th Grade
8th Grade Comparison
Chippewa
Immigrants from Korea
97.1%
8TH GRADE
100.0/ 100
METRIC RATING
31st/ 347
METRIC RANK
95.8%
8TH GRADE
57.9/ 100
METRIC RATING
172nd/ 347
METRIC RANK
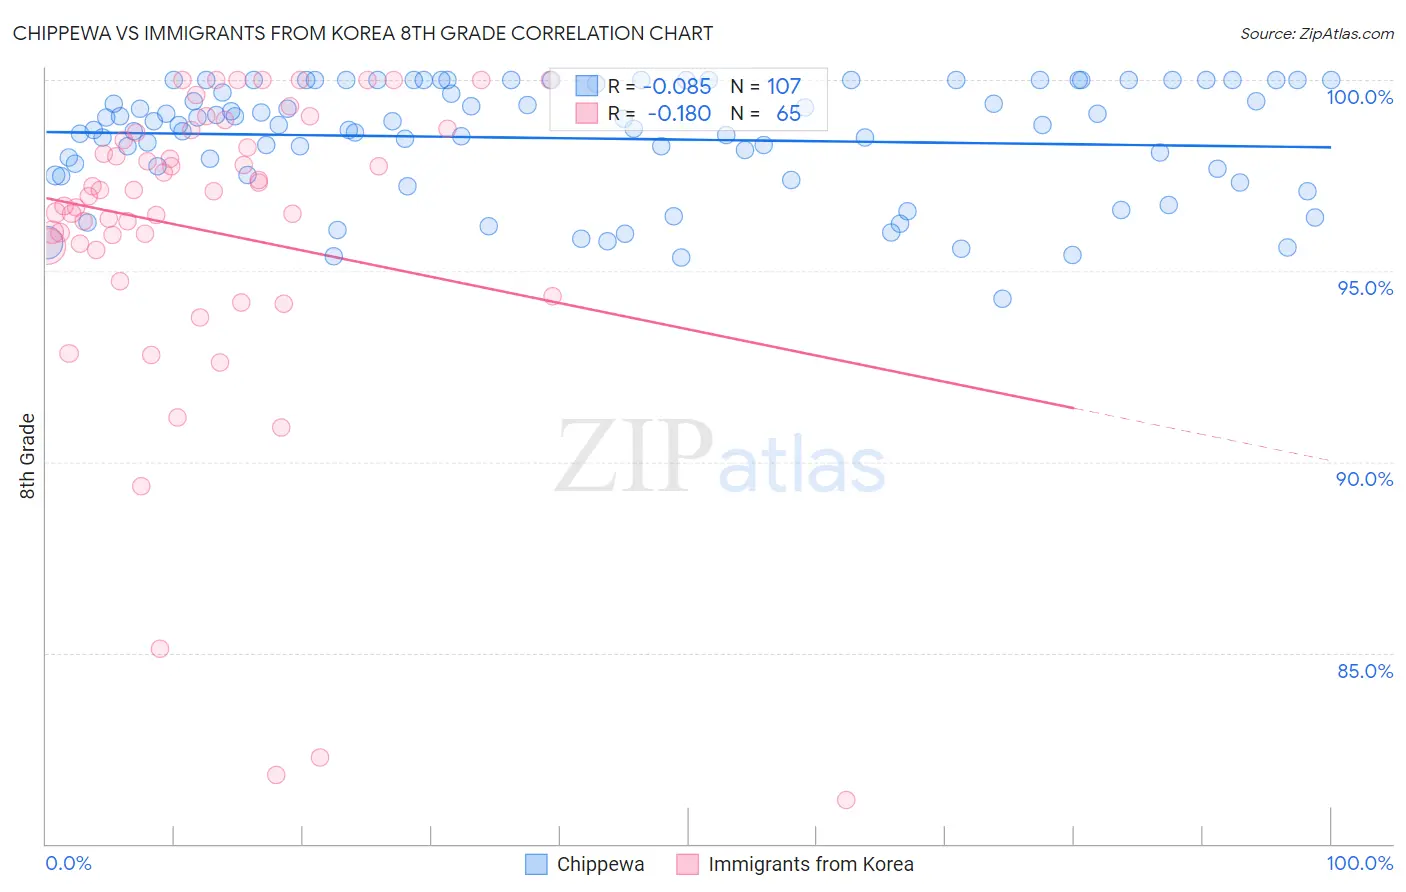
Chippewa vs Immigrants from Korea 8th Grade Correlation Chart
The statistical analysis conducted on geographies consisting of 215,065,863 people shows a slight negative correlation between the proportion of Chippewa and percentage of population with at least 8th grade education in the United States with a correlation coefficient (R) of -0.085 and weighted average of 97.1%. Similarly, the statistical analysis conducted on geographies consisting of 416,280,217 people shows a poor negative correlation between the proportion of Immigrants from Korea and percentage of population with at least 8th grade education in the United States with a correlation coefficient (R) of -0.180 and weighted average of 95.8%, a difference of 1.3%.
8th Grade Correlation Summary
| Measurement | Chippewa | Immigrants from Korea |
| Minimum | 94.3% | 81.1% |
| Maximum | 100.0% | 100.0% |
| Range | 5.7% | 18.9% |
| Mean | 98.5% | 96.0% |
| Median | 98.8% | 97.1% |
| Interquartile 25% (IQ1) | 97.5% | 95.6% |
| Interquartile 75% (IQ3) | 100.0% | 98.7% |
| Interquartile Range (IQR) | 2.5% | 3.0% |
| Standard Deviation (Sample) | 1.5% | 4.2% |
| Standard Deviation (Population) | 1.5% | 4.2% |
Similar Demographics by 8th Grade
Demographics Similar to Chippewa by 8th Grade
In terms of 8th grade, the demographic groups most similar to Chippewa are Sioux (97.1%, a difference of 0.0%), Italian (97.1%, a difference of 0.030%), European (97.1%, a difference of 0.030%), Yup'ik (97.0%, a difference of 0.030%), and Swiss (97.0%, a difference of 0.040%).
| Demographics | Rating | Rank | 8th Grade |
| Scandinavians | 100.0 /100 | #24 | Exceptional 97.2% |
| Czechs | 100.0 /100 | #25 | Exceptional 97.1% |
| French | 100.0 /100 | #26 | Exceptional 97.1% |
| Scotch-Irish | 100.0 /100 | #27 | Exceptional 97.1% |
| Italians | 100.0 /100 | #28 | Exceptional 97.1% |
| Europeans | 100.0 /100 | #29 | Exceptional 97.1% |
| Sioux | 100.0 /100 | #30 | Exceptional 97.1% |
| Chippewa | 100.0 /100 | #31 | Exceptional 97.1% |
| Yup'ik | 100.0 /100 | #32 | Exceptional 97.0% |
| Swiss | 100.0 /100 | #33 | Exceptional 97.0% |
| Luxembourgers | 100.0 /100 | #34 | Exceptional 97.0% |
| Alaska Natives | 100.0 /100 | #35 | Exceptional 97.0% |
| Belgians | 100.0 /100 | #36 | Exceptional 97.0% |
| Latvians | 100.0 /100 | #37 | Exceptional 97.0% |
| British | 100.0 /100 | #38 | Exceptional 97.0% |
Demographics Similar to Immigrants from Korea by 8th Grade
In terms of 8th grade, the demographic groups most similar to Immigrants from Korea are Immigrants from Iran (95.8%, a difference of 0.0%), Ute (95.8%, a difference of 0.0%), Egyptian (95.8%, a difference of 0.0%), Spaniard (95.8%, a difference of 0.010%), and Immigrants from Ukraine (95.8%, a difference of 0.010%).
| Demographics | Rating | Rank | 8th Grade |
| Alsatians | 61.4 /100 | #165 | Good 95.8% |
| Immigrants | Poland | 61.1 /100 | #166 | Good 95.8% |
| Spaniards | 60.0 /100 | #167 | Good 95.8% |
| Immigrants | Ukraine | 59.5 /100 | #168 | Average 95.8% |
| Immigrants | Iran | 58.6 /100 | #169 | Average 95.8% |
| Ute | 58.5 /100 | #170 | Average 95.8% |
| Egyptians | 58.2 /100 | #171 | Average 95.8% |
| Immigrants | Korea | 57.9 /100 | #172 | Average 95.8% |
| Mongolians | 53.0 /100 | #173 | Average 95.8% |
| Chileans | 50.0 /100 | #174 | Average 95.7% |
| Immigrants | Albania | 49.6 /100 | #175 | Average 95.7% |
| Pakistanis | 48.8 /100 | #176 | Average 95.7% |
| Marshallese | 47.6 /100 | #177 | Average 95.7% |
| Venezuelans | 47.5 /100 | #178 | Average 95.7% |
| Immigrants | Brazil | 45.4 /100 | #179 | Average 95.7% |