Chippewa vs Ottawa 7th Grade
COMPARE
Chippewa
Ottawa
7th Grade
7th Grade Comparison
Chippewa
Ottawa
97.3%
7TH GRADE
100.0/ 100
METRIC RATING
33rd/ 347
METRIC RANK
98.1%
7TH GRADE
100.0/ 100
METRIC RATING
4th/ 347
METRIC RANK
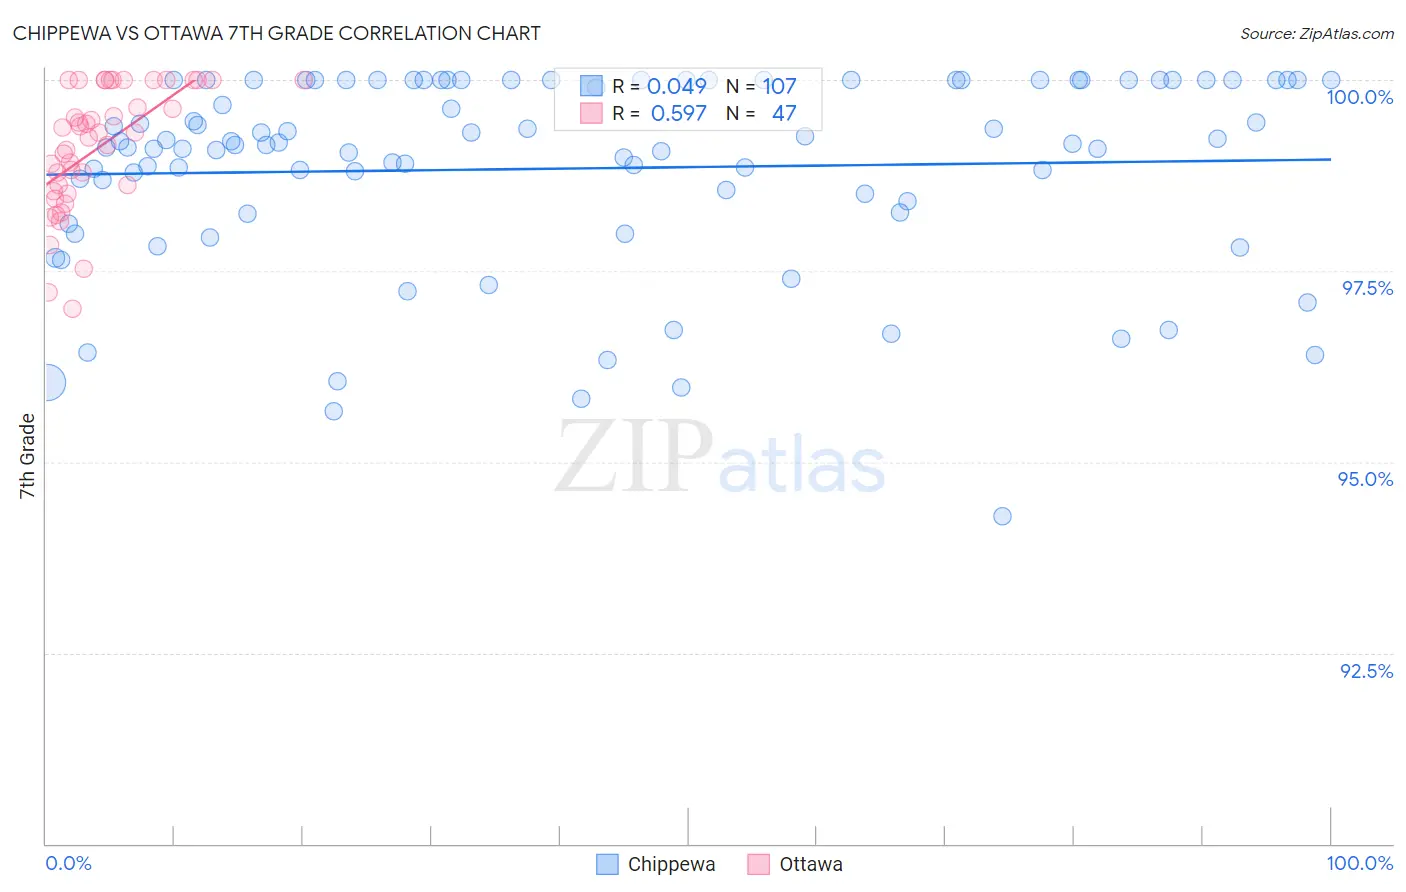
Chippewa vs Ottawa 7th Grade Correlation Chart
The statistical analysis conducted on geographies consisting of 215,065,863 people shows no correlation between the proportion of Chippewa and percentage of population with at least 7th grade education in the United States with a correlation coefficient (R) of 0.049 and weighted average of 97.3%. Similarly, the statistical analysis conducted on geographies consisting of 4,824,405 people shows a substantial positive correlation between the proportion of Ottawa and percentage of population with at least 7th grade education in the United States with a correlation coefficient (R) of 0.597 and weighted average of 98.1%, a difference of 0.83%.
7th Grade Correlation Summary
| Measurement | Chippewa | Ottawa |
| Minimum | 94.3% | 97.0% |
| Maximum | 100.0% | 100.0% |
| Range | 5.7% | 3.0% |
| Mean | 98.8% | 99.1% |
| Median | 99.1% | 99.3% |
| Interquartile 25% (IQ1) | 98.3% | 98.5% |
| Interquartile 75% (IQ3) | 100.0% | 100.0% |
| Interquartile Range (IQR) | 1.7% | 1.5% |
| Standard Deviation (Sample) | 1.3% | 0.80% |
| Standard Deviation (Population) | 1.3% | 0.79% |
Similar Demographics by 7th Grade
Demographics Similar to Chippewa by 7th Grade
In terms of 7th grade, the demographic groups most similar to Chippewa are European (97.3%, a difference of 0.010%), Italian (97.3%, a difference of 0.010%), Czech (97.4%, a difference of 0.030%), Alaska Native (97.3%, a difference of 0.030%), and Sioux (97.4%, a difference of 0.040%).
| Demographics | Rating | Rank | 7th Grade |
| Scotch-Irish | 100.0 /100 | #26 | Exceptional 97.4% |
| Danes | 100.0 /100 | #27 | Exceptional 97.4% |
| Sioux | 100.0 /100 | #28 | Exceptional 97.4% |
| Scandinavians | 100.0 /100 | #29 | Exceptional 97.4% |
| Czechs | 100.0 /100 | #30 | Exceptional 97.4% |
| Europeans | 100.0 /100 | #31 | Exceptional 97.3% |
| Italians | 100.0 /100 | #32 | Exceptional 97.3% |
| Chippewa | 100.0 /100 | #33 | Exceptional 97.3% |
| Alaska Natives | 100.0 /100 | #34 | Exceptional 97.3% |
| Swiss | 100.0 /100 | #35 | Exceptional 97.3% |
| Hungarians | 100.0 /100 | #36 | Exceptional 97.2% |
| British | 100.0 /100 | #37 | Exceptional 97.2% |
| Belgians | 100.0 /100 | #38 | Exceptional 97.2% |
| Latvians | 100.0 /100 | #39 | Exceptional 97.2% |
| Luxembourgers | 100.0 /100 | #40 | Exceptional 97.2% |
Demographics Similar to Ottawa by 7th Grade
In terms of 7th grade, the demographic groups most similar to Ottawa are Carpatho Rusyn (98.3%, a difference of 0.20%), Dutch (97.9%, a difference of 0.27%), Tsimshian (97.8%, a difference of 0.33%), Norwegian (97.8%, a difference of 0.36%), and Finnish (98.5%, a difference of 0.37%).
| Demographics | Rating | Rank | 7th Grade |
| Crow | 100.0 /100 | #1 | Exceptional 99.1% |
| Finns | 100.0 /100 | #2 | Exceptional 98.5% |
| Carpatho Rusyns | 100.0 /100 | #3 | Exceptional 98.3% |
| Ottawa | 100.0 /100 | #4 | Exceptional 98.1% |
| Dutch | 100.0 /100 | #5 | Exceptional 97.9% |
| Tsimshian | 100.0 /100 | #6 | Exceptional 97.8% |
| Norwegians | 100.0 /100 | #7 | Exceptional 97.8% |
| Slovaks | 100.0 /100 | #8 | Exceptional 97.8% |
| Germans | 100.0 /100 | #9 | Exceptional 97.7% |
| Slovenes | 100.0 /100 | #10 | Exceptional 97.6% |
| Alaskan Athabascans | 100.0 /100 | #11 | Exceptional 97.6% |
| Poles | 100.0 /100 | #12 | Exceptional 97.6% |
| Swedes | 100.0 /100 | #13 | Exceptional 97.6% |
| Pennsylvania Germans | 100.0 /100 | #14 | Exceptional 97.6% |
| English | 100.0 /100 | #15 | Exceptional 97.6% |