Choctaw vs Immigrants from Cabo Verde 10th Grade
COMPARE
Choctaw
Immigrants from Cabo Verde
10th Grade
10th Grade Comparison
Choctaw
Immigrants from Cabo Verde
93.6%
10TH GRADE
36.6/ 100
METRIC RATING
184th/ 347
METRIC RANK
89.5%
10TH GRADE
0.0/ 100
METRIC RATING
328th/ 347
METRIC RANK
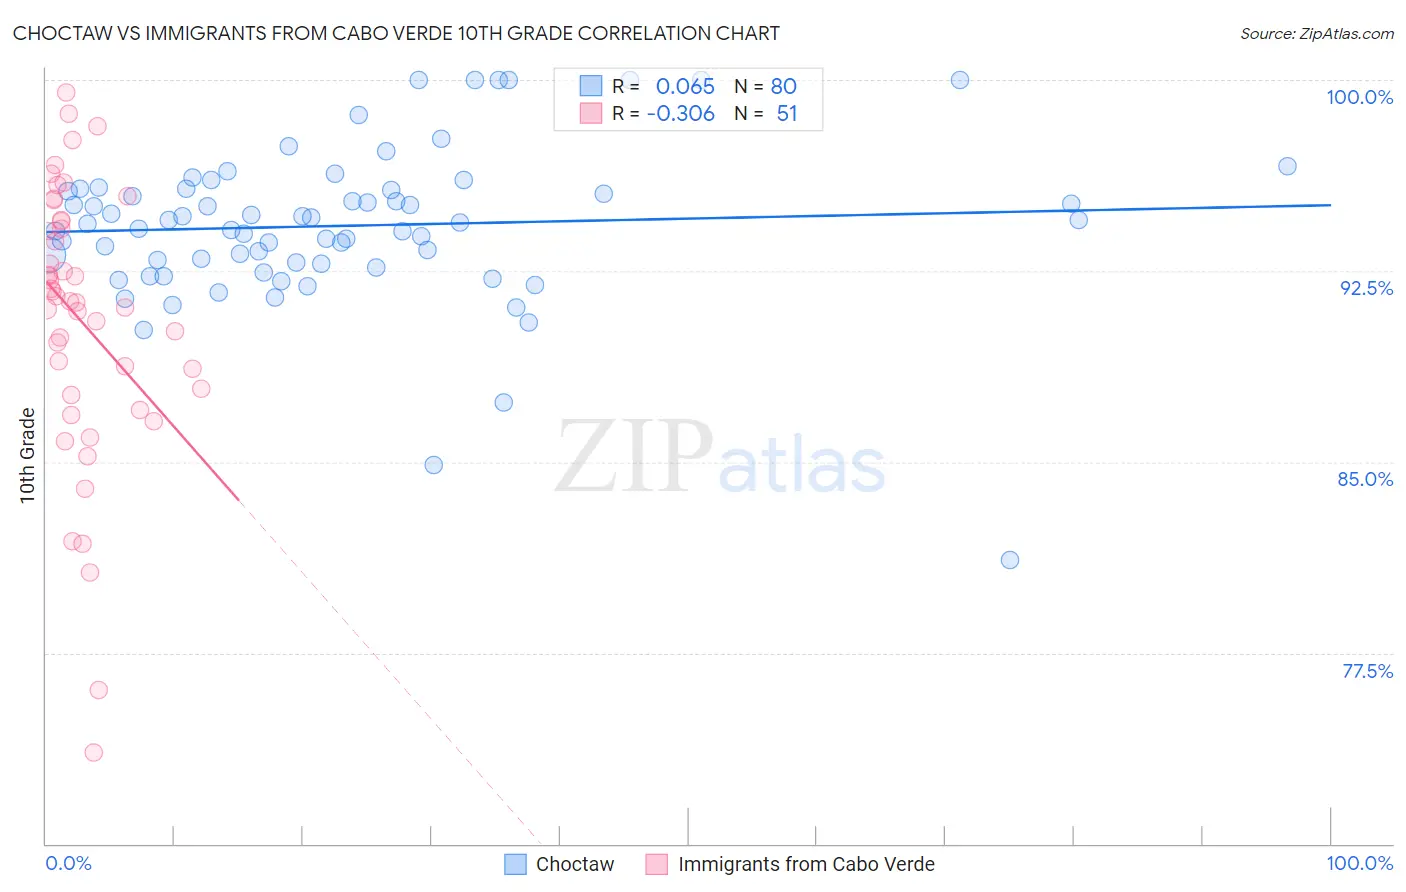
Choctaw vs Immigrants from Cabo Verde 10th Grade Correlation Chart
The statistical analysis conducted on geographies consisting of 269,742,499 people shows a slight positive correlation between the proportion of Choctaw and percentage of population with at least 10th grade education in the United States with a correlation coefficient (R) of 0.065 and weighted average of 93.6%. Similarly, the statistical analysis conducted on geographies consisting of 38,158,316 people shows a mild negative correlation between the proportion of Immigrants from Cabo Verde and percentage of population with at least 10th grade education in the United States with a correlation coefficient (R) of -0.306 and weighted average of 89.5%, a difference of 4.7%.
10th Grade Correlation Summary
| Measurement | Choctaw | Immigrants from Cabo Verde |
| Minimum | 81.1% | 73.6% |
| Maximum | 100.0% | 99.5% |
| Range | 18.9% | 25.9% |
| Mean | 94.3% | 90.6% |
| Median | 94.4% | 91.3% |
| Interquartile 25% (IQ1) | 92.8% | 87.6% |
| Interquartile 75% (IQ3) | 95.7% | 94.5% |
| Interquartile Range (IQR) | 2.9% | 6.8% |
| Standard Deviation (Sample) | 3.1% | 5.4% |
| Standard Deviation (Population) | 3.1% | 5.4% |
Similar Demographics by 10th Grade
Demographics Similar to Choctaw by 10th Grade
In terms of 10th grade, the demographic groups most similar to Choctaw are Guamanian/Chamorro (93.6%, a difference of 0.0%), Sudanese (93.6%, a difference of 0.0%), Colville (93.6%, a difference of 0.020%), Immigrants from Eastern Asia (93.6%, a difference of 0.020%), and Liberian (93.6%, a difference of 0.020%).
| Demographics | Rating | Rank | 10th Grade |
| Immigrants | Lebanon | 47.1 /100 | #177 | Average 93.7% |
| Sierra Leoneans | 46.1 /100 | #178 | Average 93.7% |
| Paraguayans | 45.3 /100 | #179 | Average 93.7% |
| Blackfeet | 42.8 /100 | #180 | Average 93.7% |
| Immigrants | Northern Africa | 41.6 /100 | #181 | Average 93.7% |
| Colville | 38.8 /100 | #182 | Fair 93.6% |
| Guamanians/Chamorros | 37.1 /100 | #183 | Fair 93.6% |
| Choctaw | 36.6 /100 | #184 | Fair 93.6% |
| Sudanese | 36.6 /100 | #185 | Fair 93.6% |
| Immigrants | Eastern Asia | 35.1 /100 | #186 | Fair 93.6% |
| Liberians | 34.7 /100 | #187 | Fair 93.6% |
| Marshallese | 33.2 /100 | #188 | Fair 93.6% |
| Immigrants | Pakistan | 32.5 /100 | #189 | Fair 93.6% |
| Laotians | 32.1 /100 | #190 | Fair 93.6% |
| Yup'ik | 31.1 /100 | #191 | Fair 93.6% |
Demographics Similar to Immigrants from Cabo Verde by 10th Grade
In terms of 10th grade, the demographic groups most similar to Immigrants from Cabo Verde are Immigrants from Nicaragua (89.5%, a difference of 0.010%), Dominican (89.4%, a difference of 0.10%), Central American Indian (89.7%, a difference of 0.27%), Puerto Rican (89.8%, a difference of 0.44%), and Immigrants from Yemen (89.1%, a difference of 0.45%).
| Demographics | Rating | Rank | 10th Grade |
| Belizeans | 0.0 /100 | #321 | Tragic 90.2% |
| Tohono O'odham | 0.0 /100 | #322 | Tragic 90.1% |
| Immigrants | Belize | 0.0 /100 | #323 | Tragic 90.1% |
| Immigrants | Armenia | 0.0 /100 | #324 | Tragic 89.9% |
| Puerto Ricans | 0.0 /100 | #325 | Tragic 89.8% |
| Central American Indians | 0.0 /100 | #326 | Tragic 89.7% |
| Immigrants | Nicaragua | 0.0 /100 | #327 | Tragic 89.5% |
| Immigrants | Cabo Verde | 0.0 /100 | #328 | Tragic 89.5% |
| Dominicans | 0.0 /100 | #329 | Tragic 89.4% |
| Immigrants | Yemen | 0.0 /100 | #330 | Tragic 89.1% |
| Mexican American Indians | 0.0 /100 | #331 | Tragic 89.0% |
| Immigrants | Azores | 0.0 /100 | #332 | Tragic 89.0% |
| Hondurans | 0.0 /100 | #333 | Tragic 89.0% |
| Hispanics or Latinos | 0.0 /100 | #334 | Tragic 88.9% |
| Immigrants | Dominican Republic | 0.0 /100 | #335 | Tragic 88.7% |