Chickasaw vs Immigrants from Scotland Nursery School
COMPARE
Chickasaw
Immigrants from Scotland
Nursery School
Nursery School Comparison
Chickasaw
Immigrants from Scotland
98.4%
NURSERY SCHOOL
99.6/ 100
METRIC RATING
72nd/ 347
METRIC RANK
98.4%
NURSERY SCHOOL
99.8/ 100
METRIC RATING
55th/ 347
METRIC RANK
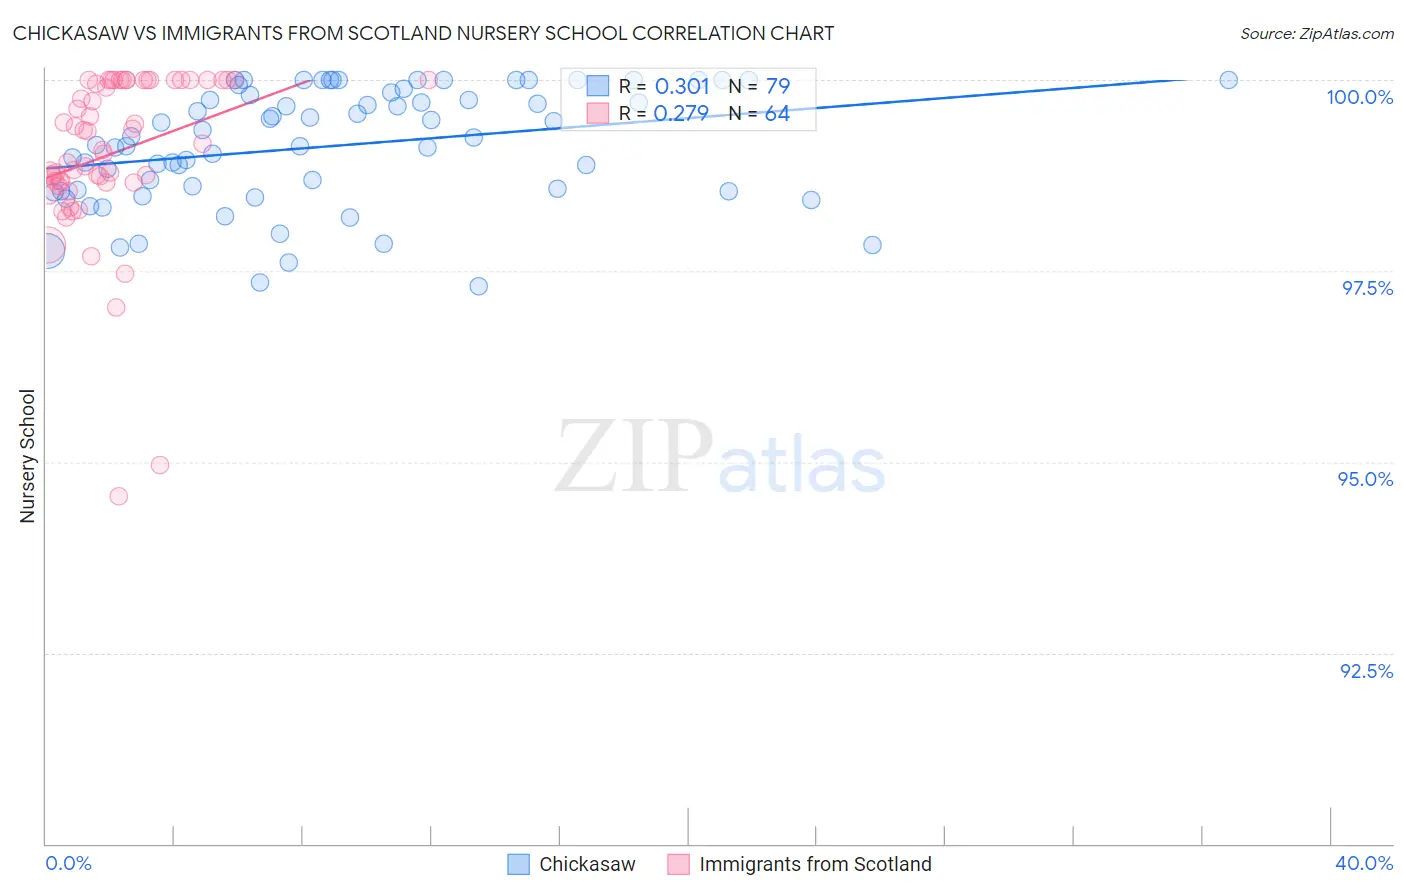
Chickasaw vs Immigrants from Scotland Nursery School Correlation Chart
The statistical analysis conducted on geographies consisting of 147,725,081 people shows a mild positive correlation between the proportion of Chickasaw and percentage of population with at least nursery school education in the United States with a correlation coefficient (R) of 0.301 and weighted average of 98.4%. Similarly, the statistical analysis conducted on geographies consisting of 196,398,887 people shows a weak positive correlation between the proportion of Immigrants from Scotland and percentage of population with at least nursery school education in the United States with a correlation coefficient (R) of 0.279 and weighted average of 98.4%, a difference of 0.050%.
Nursery School Correlation Summary
| Measurement | Chickasaw | Immigrants from Scotland |
| Minimum | 97.3% | 94.6% |
| Maximum | 100.0% | 100.0% |
| Range | 2.7% | 5.4% |
| Mean | 99.1% | 99.0% |
| Median | 99.3% | 99.1% |
| Interquartile 25% (IQ1) | 98.6% | 98.7% |
| Interquartile 75% (IQ3) | 99.8% | 100.0% |
| Interquartile Range (IQR) | 1.3% | 1.3% |
| Standard Deviation (Sample) | 0.76% | 1.1% |
| Standard Deviation (Population) | 0.76% | 1.1% |
Demographics Similar to Chickasaw and Immigrants from Scotland by Nursery School
In terms of nursery school, the demographic groups most similar to Chickasaw are Serbian (98.4%, a difference of 0.0%), Canadian (98.4%, a difference of 0.010%), Immigrants from Northern Europe (98.4%, a difference of 0.010%), Russian (98.4%, a difference of 0.010%), and Immigrants from Austria (98.4%, a difference of 0.010%). Similarly, the demographic groups most similar to Immigrants from Scotland are Pueblo (98.4%, a difference of 0.0%), Kiowa (98.4%, a difference of 0.010%), American (98.4%, a difference of 0.010%), Austrian (98.4%, a difference of 0.010%), and Bulgarian (98.4%, a difference of 0.010%).
| Demographics | Rating | Rank | Nursery School |
| Kiowa | 99.8 /100 | #53 | Exceptional 98.4% |
| Pueblo | 99.8 /100 | #54 | Exceptional 98.4% |
| Immigrants | Scotland | 99.8 /100 | #55 | Exceptional 98.4% |
| Americans | 99.8 /100 | #56 | Exceptional 98.4% |
| Austrians | 99.8 /100 | #57 | Exceptional 98.4% |
| Bulgarians | 99.8 /100 | #58 | Exceptional 98.4% |
| Immigrants | Canada | 99.8 /100 | #59 | Exceptional 98.4% |
| Slavs | 99.8 /100 | #60 | Exceptional 98.4% |
| New Zealanders | 99.7 /100 | #61 | Exceptional 98.4% |
| Creek | 99.7 /100 | #62 | Exceptional 98.4% |
| Immigrants | North America | 99.7 /100 | #63 | Exceptional 98.4% |
| Greeks | 99.7 /100 | #64 | Exceptional 98.4% |
| Maltese | 99.7 /100 | #65 | Exceptional 98.4% |
| Canadians | 99.7 /100 | #66 | Exceptional 98.4% |
| Immigrants | Northern Europe | 99.6 /100 | #67 | Exceptional 98.4% |
| Russians | 99.6 /100 | #68 | Exceptional 98.4% |
| Immigrants | Austria | 99.6 /100 | #69 | Exceptional 98.4% |
| Cheyenne | 99.6 /100 | #70 | Exceptional 98.4% |
| Serbians | 99.6 /100 | #71 | Exceptional 98.4% |
| Chickasaw | 99.6 /100 | #72 | Exceptional 98.4% |
| Cajuns | 99.4 /100 | #73 | Exceptional 98.4% |