Irish vs Immigrants 6th Grade
COMPARE
Irish
Immigrants
6th Grade
6th Grade Comparison
Irish
Immigrants
98.1%
6TH GRADE
100.0/ 100
METRIC RATING
19th/ 347
METRIC RANK
95.7%
6TH GRADE
0.0/ 100
METRIC RATING
301st/ 347
METRIC RANK
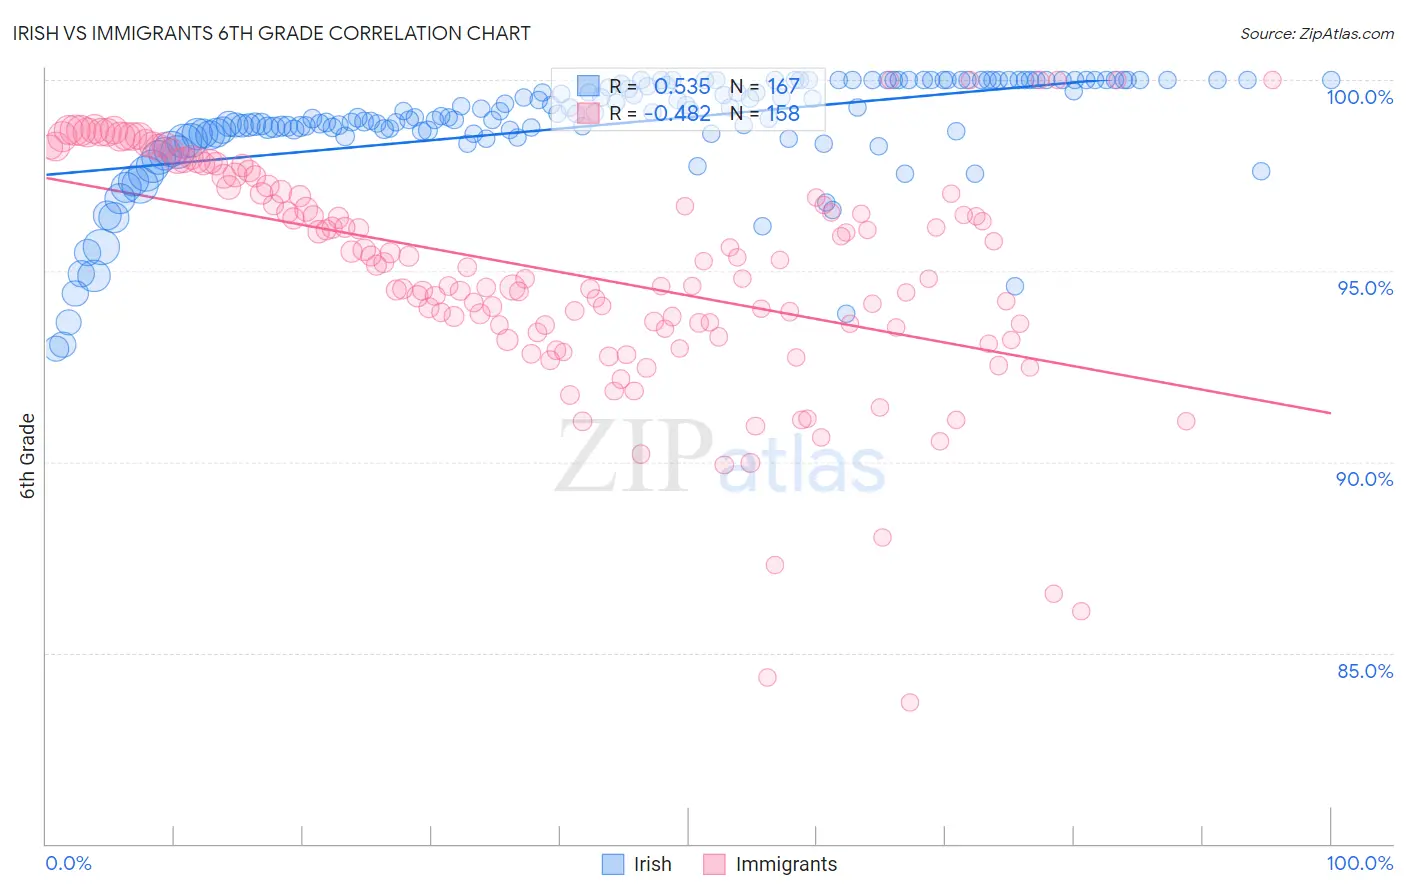
Irish vs Immigrants 6th Grade Correlation Chart
The statistical analysis conducted on geographies consisting of 568,142,060 people shows a substantial positive correlation between the proportion of Irish and percentage of population with at least 6th grade education in the United States with a correlation coefficient (R) of 0.535 and weighted average of 98.1%. Similarly, the statistical analysis conducted on geographies consisting of 577,786,840 people shows a moderate negative correlation between the proportion of Immigrants and percentage of population with at least 6th grade education in the United States with a correlation coefficient (R) of -0.482 and weighted average of 95.7%, a difference of 2.5%.
6th Grade Correlation Summary
| Measurement | Irish | Immigrants |
| Minimum | 93.0% | 83.7% |
| Maximum | 100.0% | 100.0% |
| Range | 7.0% | 16.3% |
| Mean | 98.8% | 95.0% |
| Median | 99.0% | 95.1% |
| Interquartile 25% (IQ1) | 98.6% | 93.5% |
| Interquartile 75% (IQ3) | 100.0% | 97.2% |
| Interquartile Range (IQR) | 1.4% | 3.7% |
| Standard Deviation (Sample) | 1.4% | 3.0% |
| Standard Deviation (Population) | 1.4% | 3.0% |
Similar Demographics by 6th Grade
Demographics Similar to Irish by 6th Grade
In terms of 6th grade, the demographic groups most similar to Irish are Scottish (98.1%, a difference of 0.010%), Polish (98.1%, a difference of 0.010%), Pennsylvania German (98.1%, a difference of 0.010%), Finnish (98.1%, a difference of 0.010%), and Inupiat (98.1%, a difference of 0.020%).
| Demographics | Rating | Rank | 6th Grade |
| Alaskan Athabascans | 100.0 /100 | #12 | Exceptional 98.1% |
| Tlingit-Haida | 100.0 /100 | #13 | Exceptional 98.1% |
| Carpatho Rusyns | 100.0 /100 | #14 | Exceptional 98.1% |
| Inupiat | 100.0 /100 | #15 | Exceptional 98.1% |
| Scottish | 100.0 /100 | #16 | Exceptional 98.1% |
| Poles | 100.0 /100 | #17 | Exceptional 98.1% |
| Pennsylvania Germans | 100.0 /100 | #18 | Exceptional 98.1% |
| Irish | 100.0 /100 | #19 | Exceptional 98.1% |
| Finns | 100.0 /100 | #20 | Exceptional 98.1% |
| Lithuanians | 100.0 /100 | #21 | Exceptional 98.1% |
| Danes | 100.0 /100 | #22 | Exceptional 98.0% |
| Sioux | 100.0 /100 | #23 | Exceptional 98.0% |
| Croatians | 100.0 /100 | #24 | Exceptional 98.0% |
| Scotch-Irish | 100.0 /100 | #25 | Exceptional 98.0% |
| Czechs | 100.0 /100 | #26 | Exceptional 98.0% |
Demographics Similar to Immigrants by 6th Grade
In terms of 6th grade, the demographic groups most similar to Immigrants are Immigrants from Dominica (95.7%, a difference of 0.010%), Immigrants from Laos (95.7%, a difference of 0.020%), Immigrants from Burma/Myanmar (95.7%, a difference of 0.020%), Sri Lankan (95.8%, a difference of 0.030%), and Bangladeshi (95.7%, a difference of 0.080%).
| Demographics | Rating | Rank | 6th Grade |
| British West Indians | 0.0 /100 | #294 | Tragic 96.0% |
| Immigrants | Grenada | 0.0 /100 | #295 | Tragic 95.9% |
| Immigrants | South Eastern Asia | 0.0 /100 | #296 | Tragic 95.9% |
| Haitians | 0.0 /100 | #297 | Tragic 95.8% |
| Sri Lankans | 0.0 /100 | #298 | Tragic 95.8% |
| Immigrants | Laos | 0.0 /100 | #299 | Tragic 95.7% |
| Immigrants | Dominica | 0.0 /100 | #300 | Tragic 95.7% |
| Immigrants | Immigrants | 0.0 /100 | #301 | Tragic 95.7% |
| Immigrants | Burma/Myanmar | 0.0 /100 | #302 | Tragic 95.7% |
| Bangladeshis | 0.0 /100 | #303 | Tragic 95.7% |
| Indonesians | 0.0 /100 | #304 | Tragic 95.6% |
| Immigrants | Cuba | 0.0 /100 | #305 | Tragic 95.6% |
| Immigrants | Haiti | 0.0 /100 | #306 | Tragic 95.6% |
| Guyanese | 0.0 /100 | #307 | Tragic 95.6% |
| Immigrants | Caribbean | 0.0 /100 | #308 | Tragic 95.6% |