Cheyenne vs Slavic 7th Grade
COMPARE
Cheyenne
Slavic
7th Grade
7th Grade Comparison
Cheyenne
Slavs
96.5%
7TH GRADE
94.9/ 100
METRIC RATING
121st/ 347
METRIC RANK
97.1%
7TH GRADE
99.9/ 100
METRIC RATING
49th/ 347
METRIC RANK
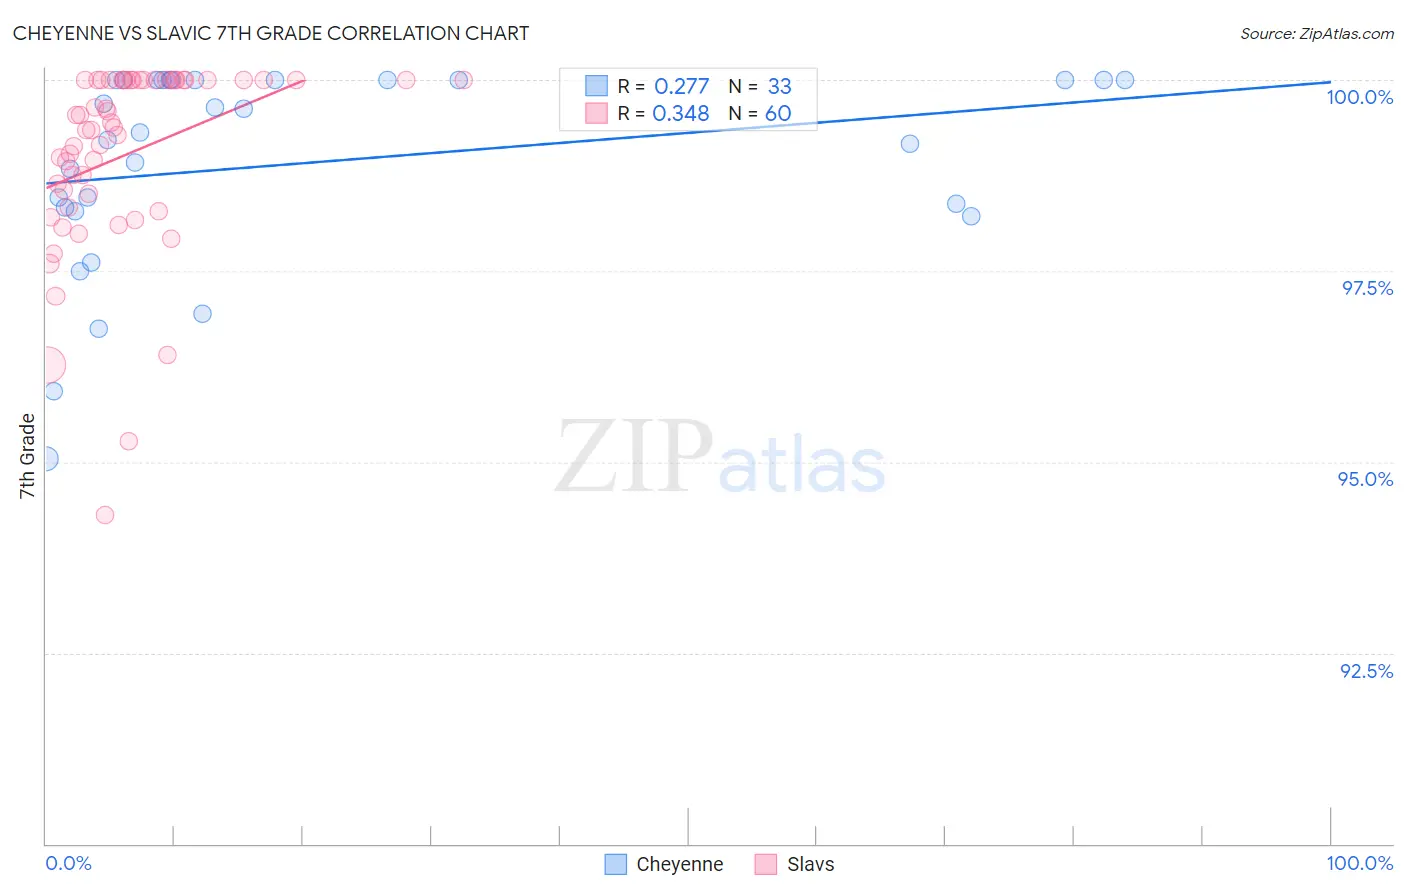
Cheyenne vs Slavic 7th Grade Correlation Chart
The statistical analysis conducted on geographies consisting of 80,716,760 people shows a weak positive correlation between the proportion of Cheyenne and percentage of population with at least 7th grade education in the United States with a correlation coefficient (R) of 0.277 and weighted average of 96.5%. Similarly, the statistical analysis conducted on geographies consisting of 270,869,056 people shows a mild positive correlation between the proportion of Slavs and percentage of population with at least 7th grade education in the United States with a correlation coefficient (R) of 0.348 and weighted average of 97.1%, a difference of 0.61%.
7th Grade Correlation Summary
| Measurement | Cheyenne | Slavic |
| Minimum | 95.0% | 94.3% |
| Maximum | 100.0% | 100.0% |
| Range | 5.0% | 5.7% |
| Mean | 98.9% | 99.0% |
| Median | 99.3% | 99.4% |
| Interquartile 25% (IQ1) | 98.3% | 98.4% |
| Interquartile 75% (IQ3) | 100.0% | 100.0% |
| Interquartile Range (IQR) | 1.7% | 1.6% |
| Standard Deviation (Sample) | 1.3% | 1.2% |
| Standard Deviation (Population) | 1.3% | 1.2% |
Similar Demographics by 7th Grade
Demographics Similar to Cheyenne by 7th Grade
In terms of 7th grade, the demographic groups most similar to Cheyenne are Immigrants from Croatia (96.5%, a difference of 0.0%), Immigrants from Europe (96.5%, a difference of 0.0%), Immigrants from Norway (96.5%, a difference of 0.010%), Immigrants from France (96.5%, a difference of 0.010%), and Immigrants from Switzerland (96.5%, a difference of 0.010%).
| Demographics | Rating | Rank | 7th Grade |
| Immigrants | Zimbabwe | 96.6 /100 | #114 | Exceptional 96.5% |
| Choctaw | 96.6 /100 | #115 | Exceptional 96.5% |
| Syrians | 96.6 /100 | #116 | Exceptional 96.5% |
| Immigrants | Moldova | 95.7 /100 | #117 | Exceptional 96.5% |
| Immigrants | Japan | 95.5 /100 | #118 | Exceptional 96.5% |
| Immigrants | Norway | 95.2 /100 | #119 | Exceptional 96.5% |
| Immigrants | Croatia | 95.0 /100 | #120 | Exceptional 96.5% |
| Cheyenne | 94.9 /100 | #121 | Exceptional 96.5% |
| Immigrants | Europe | 94.8 /100 | #122 | Exceptional 96.5% |
| Immigrants | France | 94.7 /100 | #123 | Exceptional 96.5% |
| Immigrants | Switzerland | 94.5 /100 | #124 | Exceptional 96.5% |
| Immigrants | Bulgaria | 94.0 /100 | #125 | Exceptional 96.4% |
| Palestinians | 93.5 /100 | #126 | Exceptional 96.4% |
| Immigrants | Bosnia and Herzegovina | 93.3 /100 | #127 | Exceptional 96.4% |
| Immigrants | Romania | 93.2 /100 | #128 | Exceptional 96.4% |
Demographics Similar to Slavs by 7th Grade
In terms of 7th grade, the demographic groups most similar to Slavs are Immigrants from Scotland (97.1%, a difference of 0.0%), Bulgarian (97.1%, a difference of 0.010%), Celtic (97.1%, a difference of 0.010%), Estonian (97.0%, a difference of 0.030%), and Czechoslovakian (97.1%, a difference of 0.040%).
| Demographics | Rating | Rank | 7th Grade |
| Chinese | 99.9 /100 | #42 | Exceptional 97.1% |
| Maltese | 99.9 /100 | #43 | Exceptional 97.1% |
| Northern Europeans | 99.9 /100 | #44 | Exceptional 97.1% |
| Czechoslovakians | 99.9 /100 | #45 | Exceptional 97.1% |
| Aleuts | 99.9 /100 | #46 | Exceptional 97.1% |
| Bulgarians | 99.9 /100 | #47 | Exceptional 97.1% |
| Celtics | 99.9 /100 | #48 | Exceptional 97.1% |
| Slavs | 99.9 /100 | #49 | Exceptional 97.1% |
| Immigrants | Scotland | 99.9 /100 | #50 | Exceptional 97.1% |
| Estonians | 99.9 /100 | #51 | Exceptional 97.0% |
| Greeks | 99.9 /100 | #52 | Exceptional 97.0% |
| Austrians | 99.8 /100 | #53 | Exceptional 97.0% |
| Australians | 99.8 /100 | #54 | Exceptional 97.0% |
| Russians | 99.8 /100 | #55 | Exceptional 97.0% |
| Serbians | 99.8 /100 | #56 | Exceptional 97.0% |