Central American vs Yup'ik High School Diploma
COMPARE
Central American
Yup'ik
High School Diploma
High School Diploma Comparison
Central Americans
Yup'ik
82.5%
HIGH SCHOOL DIPLOMA
0.0/ 100
METRIC RATING
331st/ 347
METRIC RANK
86.1%
HIGH SCHOOL DIPLOMA
0.0/ 100
METRIC RATING
289th/ 347
METRIC RANK
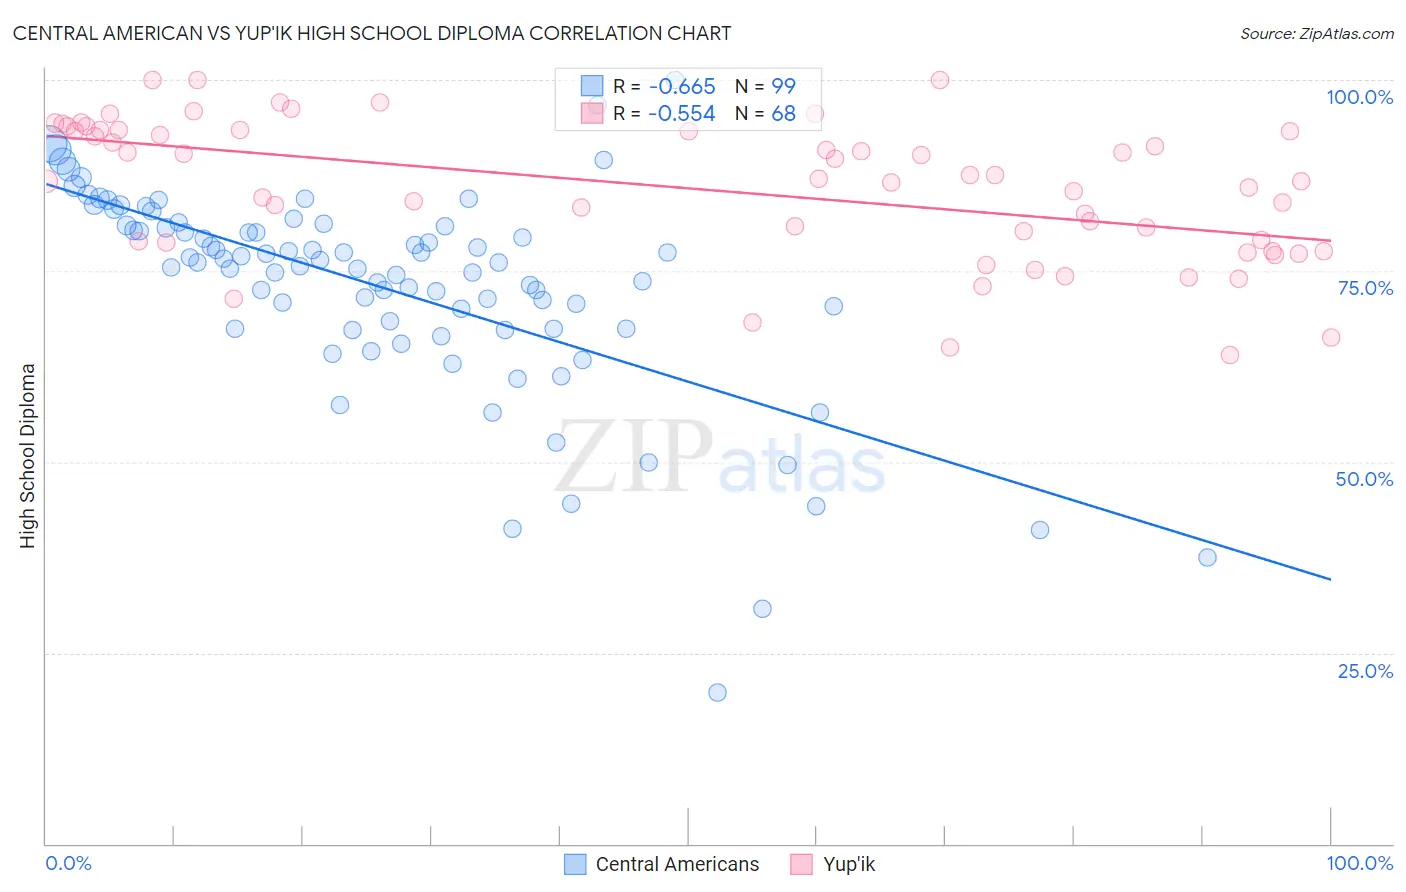
Central American vs Yup'ik High School Diploma Correlation Chart
The statistical analysis conducted on geographies consisting of 504,619,347 people shows a significant negative correlation between the proportion of Central Americans and percentage of population with at least high school diploma education in the United States with a correlation coefficient (R) of -0.665 and weighted average of 82.5%. Similarly, the statistical analysis conducted on geographies consisting of 39,964,654 people shows a substantial negative correlation between the proportion of Yup'ik and percentage of population with at least high school diploma education in the United States with a correlation coefficient (R) of -0.554 and weighted average of 86.1%, a difference of 4.3%.
High School Diploma Correlation Summary
| Measurement | Central American | Yup'ik |
| Minimum | 19.8% | 64.0% |
| Maximum | 100.0% | 100.0% |
| Range | 80.2% | 36.0% |
| Mean | 72.8% | 85.8% |
| Median | 76.0% | 86.9% |
| Interquartile 25% (IQ1) | 67.5% | 78.9% |
| Interquartile 75% (IQ3) | 80.9% | 93.4% |
| Interquartile Range (IQR) | 13.4% | 14.5% |
| Standard Deviation (Sample) | 13.7% | 9.1% |
| Standard Deviation (Population) | 13.6% | 9.0% |
Similar Demographics by High School Diploma
Demographics Similar to Central Americans by High School Diploma
In terms of high school diploma, the demographic groups most similar to Central Americans are Immigrants from Honduras (82.5%, a difference of 0.10%), Immigrants from the Azores (82.8%, a difference of 0.31%), Hispanic or Latino (82.9%, a difference of 0.39%), Dominican (82.9%, a difference of 0.49%), and Immigrants from Latin America (82.1%, a difference of 0.49%).
| Demographics | Rating | Rank | High School Diploma |
| Immigrants | Cabo Verde | 0.0 /100 | #324 | Tragic 83.3% |
| Immigrants | Nicaragua | 0.0 /100 | #325 | Tragic 83.1% |
| Mexican American Indians | 0.0 /100 | #326 | Tragic 83.0% |
| Hondurans | 0.0 /100 | #327 | Tragic 83.0% |
| Dominicans | 0.0 /100 | #328 | Tragic 82.9% |
| Hispanics or Latinos | 0.0 /100 | #329 | Tragic 82.9% |
| Immigrants | Azores | 0.0 /100 | #330 | Tragic 82.8% |
| Central Americans | 0.0 /100 | #331 | Tragic 82.5% |
| Immigrants | Honduras | 0.0 /100 | #332 | Tragic 82.5% |
| Immigrants | Latin America | 0.0 /100 | #333 | Tragic 82.1% |
| Tohono O'odham | 0.0 /100 | #334 | Tragic 82.1% |
| Guatemalans | 0.0 /100 | #335 | Tragic 82.0% |
| Immigrants | Dominican Republic | 0.0 /100 | #336 | Tragic 82.0% |
| Immigrants | Yemen | 0.0 /100 | #337 | Tragic 81.8% |
| Salvadorans | 0.0 /100 | #338 | Tragic 81.7% |
Demographics Similar to Yup'ik by High School Diploma
In terms of high school diploma, the demographic groups most similar to Yup'ik are Fijian (86.0%, a difference of 0.070%), Immigrants from Vietnam (86.2%, a difference of 0.11%), Ute (86.2%, a difference of 0.12%), Immigrants from St. Vincent and the Grenadines (86.2%, a difference of 0.15%), and Immigrants from West Indies (86.2%, a difference of 0.17%).
| Demographics | Rating | Rank | High School Diploma |
| Dutch West Indians | 0.0 /100 | #282 | Tragic 86.5% |
| Immigrants | Barbados | 0.0 /100 | #283 | Tragic 86.4% |
| Paiute | 0.0 /100 | #284 | Tragic 86.4% |
| Immigrants | West Indies | 0.0 /100 | #285 | Tragic 86.2% |
| Immigrants | St. Vincent and the Grenadines | 0.0 /100 | #286 | Tragic 86.2% |
| Ute | 0.0 /100 | #287 | Tragic 86.2% |
| Immigrants | Vietnam | 0.0 /100 | #288 | Tragic 86.2% |
| Yup'ik | 0.0 /100 | #289 | Tragic 86.1% |
| Fijians | 0.0 /100 | #290 | Tragic 86.0% |
| Haitians | 0.0 /100 | #291 | Tragic 85.9% |
| Japanese | 0.0 /100 | #292 | Tragic 85.9% |
| British West Indians | 0.0 /100 | #293 | Tragic 85.9% |
| Immigrants | Fiji | 0.0 /100 | #294 | Tragic 85.8% |
| Immigrants | Immigrants | 0.0 /100 | #295 | Tragic 85.8% |
| Immigrants | Cambodia | 0.0 /100 | #296 | Tragic 85.6% |