Central American vs Pueblo 9th Grade
COMPARE
Central American
Pueblo
9th Grade
9th Grade Comparison
Central Americans
Pueblo
90.4%
9TH GRADE
0.0/ 100
METRIC RATING
338th/ 347
METRIC RANK
95.1%
9TH GRADE
82.2/ 100
METRIC RATING
145th/ 347
METRIC RANK
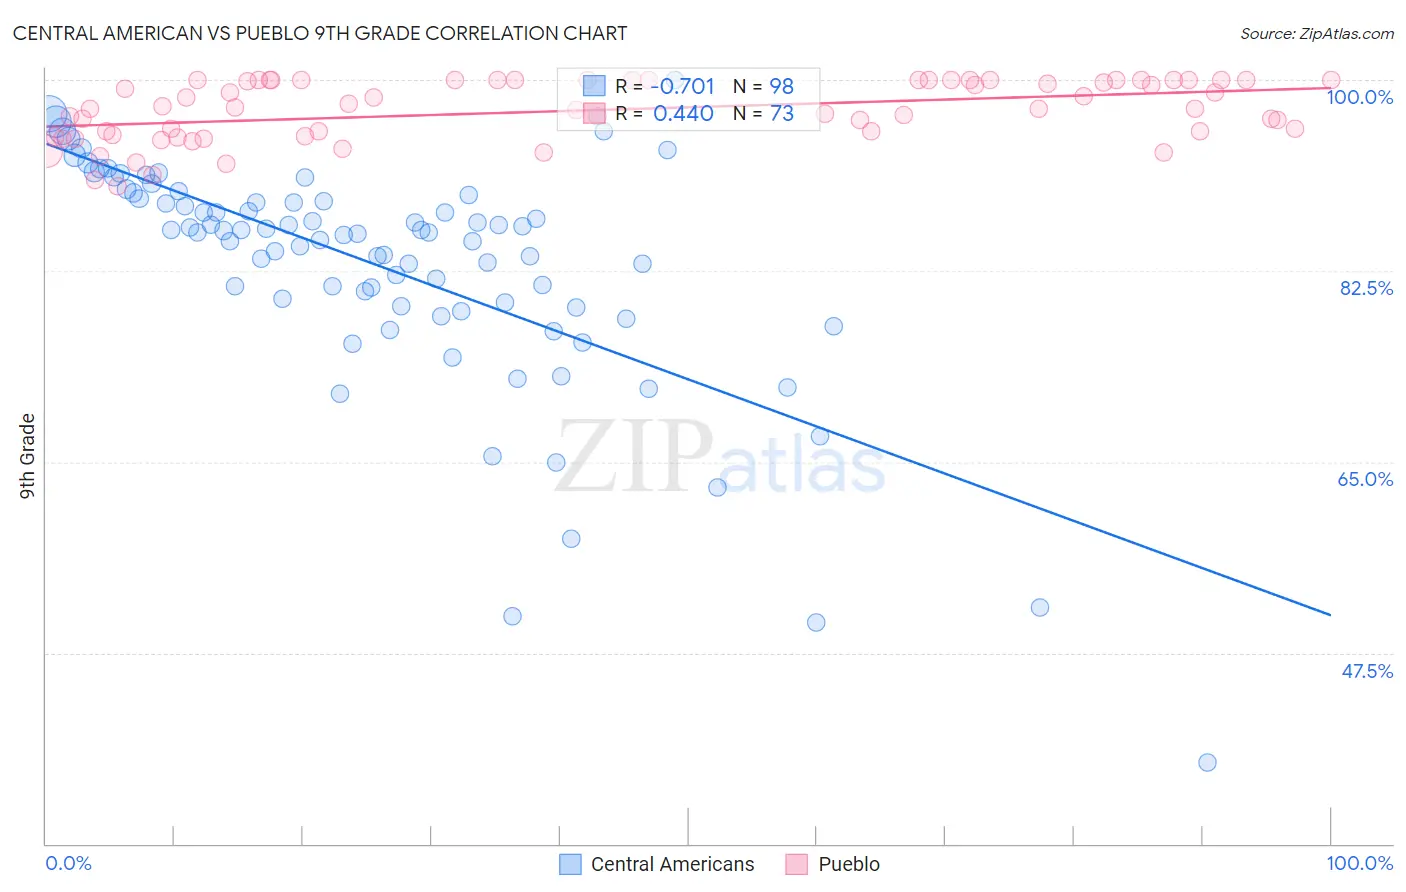
Central American vs Pueblo 9th Grade Correlation Chart
The statistical analysis conducted on geographies consisting of 504,619,198 people shows a strong negative correlation between the proportion of Central Americans and percentage of population with at least 9th grade education in the United States with a correlation coefficient (R) of -0.701 and weighted average of 90.4%. Similarly, the statistical analysis conducted on geographies consisting of 120,086,078 people shows a moderate positive correlation between the proportion of Pueblo and percentage of population with at least 9th grade education in the United States with a correlation coefficient (R) of 0.440 and weighted average of 95.1%, a difference of 5.3%.
9th Grade Correlation Summary
| Measurement | Central American | Pueblo |
| Minimum | 37.5% | 90.3% |
| Maximum | 100.0% | 100.0% |
| Range | 62.5% | 9.7% |
| Mean | 82.9% | 97.2% |
| Median | 86.0% | 97.5% |
| Interquartile 25% (IQ1) | 79.3% | 94.9% |
| Interquartile 75% (IQ3) | 89.2% | 100.0% |
| Interquartile Range (IQR) | 9.9% | 5.1% |
| Standard Deviation (Sample) | 10.7% | 2.8% |
| Standard Deviation (Population) | 10.7% | 2.7% |
Similar Demographics by 9th Grade
Demographics Similar to Central Americans by 9th Grade
In terms of 9th grade, the demographic groups most similar to Central Americans are Immigrants from Latin America (90.4%, a difference of 0.010%), Immigrants from Dominican Republic (90.5%, a difference of 0.13%), Immigrants from Honduras (90.6%, a difference of 0.26%), Yakama (90.1%, a difference of 0.34%), and Mexican (90.0%, a difference of 0.40%).
| Demographics | Rating | Rank | 9th Grade |
| Mexican American Indians | 0.0 /100 | #331 | Tragic 90.9% |
| Hispanics or Latinos | 0.0 /100 | #332 | Tragic 90.9% |
| Immigrants | Yemen | 0.0 /100 | #333 | Tragic 90.8% |
| Immigrants | Azores | 0.0 /100 | #334 | Tragic 90.8% |
| Immigrants | Honduras | 0.0 /100 | #335 | Tragic 90.6% |
| Immigrants | Dominican Republic | 0.0 /100 | #336 | Tragic 90.5% |
| Immigrants | Latin America | 0.0 /100 | #337 | Tragic 90.4% |
| Central Americans | 0.0 /100 | #338 | Tragic 90.4% |
| Yakama | 0.0 /100 | #339 | Tragic 90.1% |
| Mexicans | 0.0 /100 | #340 | Tragic 90.0% |
| Guatemalans | 0.0 /100 | #341 | Tragic 89.9% |
| Salvadorans | 0.0 /100 | #342 | Tragic 89.6% |
| Immigrants | Guatemala | 0.0 /100 | #343 | Tragic 89.4% |
| Immigrants | El Salvador | 0.0 /100 | #344 | Tragic 89.0% |
| Immigrants | Central America | 0.0 /100 | #345 | Tragic 89.0% |
Demographics Similar to Pueblo by 9th Grade
In terms of 9th grade, the demographic groups most similar to Pueblo are Immigrants from Sri Lanka (95.1%, a difference of 0.0%), Choctaw (95.1%, a difference of 0.0%), Immigrants from Jordan (95.1%, a difference of 0.010%), Yup'ik (95.2%, a difference of 0.020%), and Immigrants from Greece (95.2%, a difference of 0.030%).
| Demographics | Rating | Rank | 9th Grade |
| Immigrants | Russia | 86.6 /100 | #138 | Excellent 95.2% |
| Immigrants | Eastern Europe | 85.8 /100 | #139 | Excellent 95.2% |
| Immigrants | Taiwan | 85.3 /100 | #140 | Excellent 95.2% |
| Immigrants | Bosnia and Herzegovina | 85.2 /100 | #141 | Excellent 95.2% |
| Immigrants | Greece | 84.6 /100 | #142 | Excellent 95.2% |
| Spanish | 84.4 /100 | #143 | Excellent 95.2% |
| Yup'ik | 83.3 /100 | #144 | Excellent 95.2% |
| Pueblo | 82.2 /100 | #145 | Excellent 95.1% |
| Immigrants | Sri Lanka | 82.1 /100 | #146 | Excellent 95.1% |
| Choctaw | 81.9 /100 | #147 | Excellent 95.1% |
| Immigrants | Jordan | 81.2 /100 | #148 | Excellent 95.1% |
| Immigrants | Korea | 79.6 /100 | #149 | Good 95.1% |
| Kenyans | 79.1 /100 | #150 | Good 95.1% |
| Cajuns | 77.3 /100 | #151 | Good 95.1% |
| Ugandans | 77.0 /100 | #152 | Good 95.1% |