Central American vs Immigrants from Sierra Leone 9th Grade
COMPARE
Central American
Immigrants from Sierra Leone
9th Grade
9th Grade Comparison
Central Americans
Immigrants from Sierra Leone
90.4%
9TH GRADE
0.0/ 100
METRIC RATING
338th/ 347
METRIC RANK
94.4%
9TH GRADE
4.8/ 100
METRIC RATING
227th/ 347
METRIC RANK
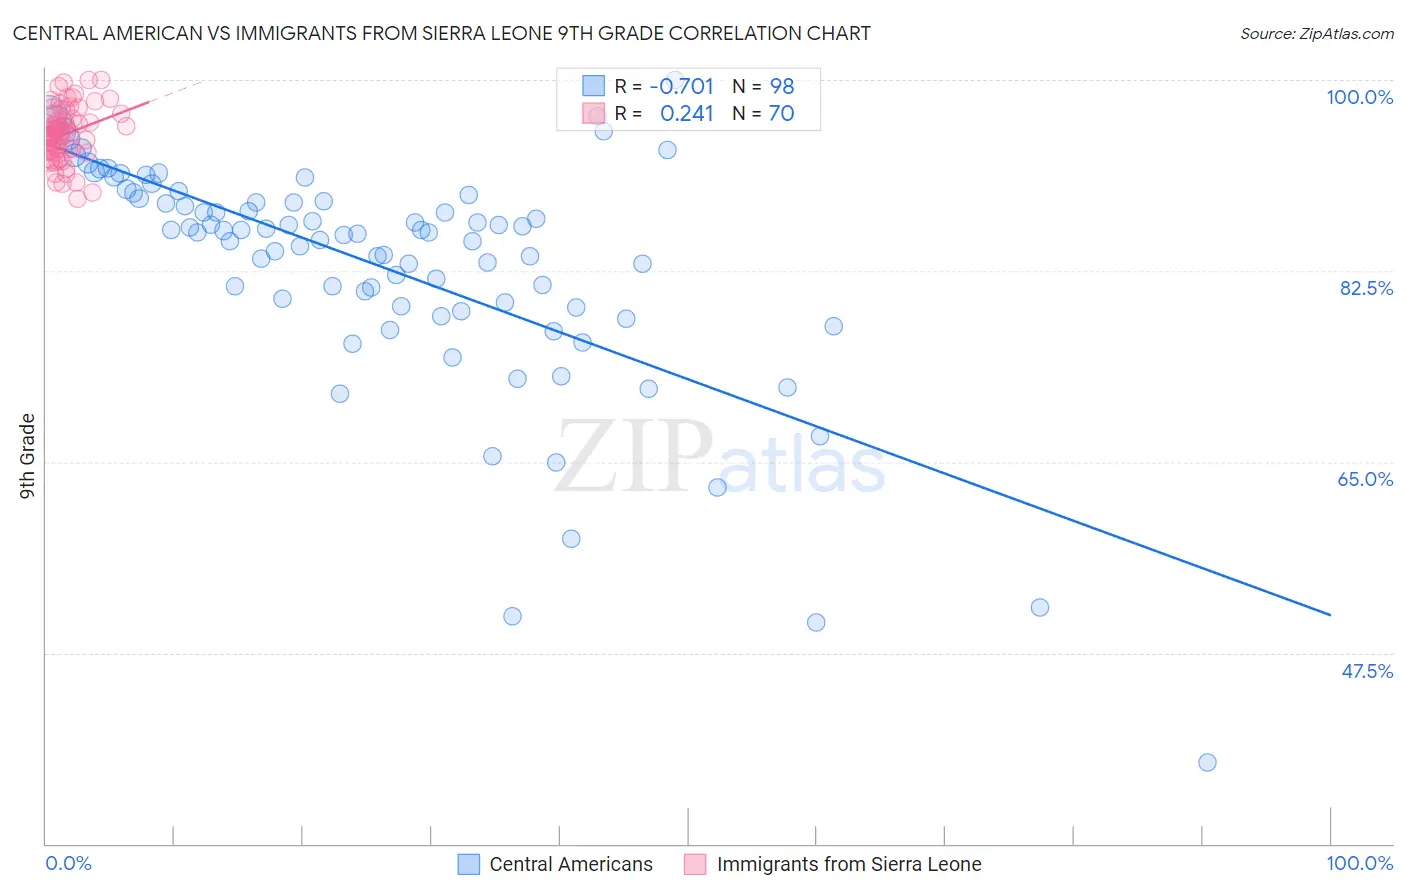
Central American vs Immigrants from Sierra Leone 9th Grade Correlation Chart
The statistical analysis conducted on geographies consisting of 504,619,198 people shows a strong negative correlation between the proportion of Central Americans and percentage of population with at least 9th grade education in the United States with a correlation coefficient (R) of -0.701 and weighted average of 90.4%. Similarly, the statistical analysis conducted on geographies consisting of 101,634,956 people shows a weak positive correlation between the proportion of Immigrants from Sierra Leone and percentage of population with at least 9th grade education in the United States with a correlation coefficient (R) of 0.241 and weighted average of 94.4%, a difference of 4.4%.
9th Grade Correlation Summary
| Measurement | Central American | Immigrants from Sierra Leone |
| Minimum | 37.5% | 89.1% |
| Maximum | 100.0% | 100.0% |
| Range | 62.5% | 10.9% |
| Mean | 82.9% | 95.0% |
| Median | 86.0% | 95.1% |
| Interquartile 25% (IQ1) | 79.3% | 93.5% |
| Interquartile 75% (IQ3) | 89.2% | 96.9% |
| Interquartile Range (IQR) | 9.9% | 3.4% |
| Standard Deviation (Sample) | 10.7% | 2.5% |
| Standard Deviation (Population) | 10.7% | 2.5% |
Similar Demographics by 9th Grade
Demographics Similar to Central Americans by 9th Grade
In terms of 9th grade, the demographic groups most similar to Central Americans are Immigrants from Latin America (90.4%, a difference of 0.010%), Immigrants from Dominican Republic (90.5%, a difference of 0.13%), Immigrants from Honduras (90.6%, a difference of 0.26%), Yakama (90.1%, a difference of 0.34%), and Mexican (90.0%, a difference of 0.40%).
| Demographics | Rating | Rank | 9th Grade |
| Mexican American Indians | 0.0 /100 | #331 | Tragic 90.9% |
| Hispanics or Latinos | 0.0 /100 | #332 | Tragic 90.9% |
| Immigrants | Yemen | 0.0 /100 | #333 | Tragic 90.8% |
| Immigrants | Azores | 0.0 /100 | #334 | Tragic 90.8% |
| Immigrants | Honduras | 0.0 /100 | #335 | Tragic 90.6% |
| Immigrants | Dominican Republic | 0.0 /100 | #336 | Tragic 90.5% |
| Immigrants | Latin America | 0.0 /100 | #337 | Tragic 90.4% |
| Central Americans | 0.0 /100 | #338 | Tragic 90.4% |
| Yakama | 0.0 /100 | #339 | Tragic 90.1% |
| Mexicans | 0.0 /100 | #340 | Tragic 90.0% |
| Guatemalans | 0.0 /100 | #341 | Tragic 89.9% |
| Salvadorans | 0.0 /100 | #342 | Tragic 89.6% |
| Immigrants | Guatemala | 0.0 /100 | #343 | Tragic 89.4% |
| Immigrants | El Salvador | 0.0 /100 | #344 | Tragic 89.0% |
| Immigrants | Central America | 0.0 /100 | #345 | Tragic 89.0% |
Demographics Similar to Immigrants from Sierra Leone by 9th Grade
In terms of 9th grade, the demographic groups most similar to Immigrants from Sierra Leone are Lumbee (94.4%, a difference of 0.0%), Immigrants from Southern Europe (94.3%, a difference of 0.010%), Ethiopian (94.4%, a difference of 0.020%), Subsaharan African (94.4%, a difference of 0.020%), and Apache (94.3%, a difference of 0.030%).
| Demographics | Rating | Rank | 9th Grade |
| Indians (Asian) | 8.6 /100 | #220 | Tragic 94.5% |
| Immigrants | Eastern Africa | 8.2 /100 | #221 | Tragic 94.5% |
| Immigrants | Asia | 7.7 /100 | #222 | Tragic 94.4% |
| Bahamians | 7.0 /100 | #223 | Tragic 94.4% |
| Tongans | 6.0 /100 | #224 | Tragic 94.4% |
| Ethiopians | 5.4 /100 | #225 | Tragic 94.4% |
| Sub-Saharan Africans | 5.4 /100 | #226 | Tragic 94.4% |
| Immigrants | Sierra Leone | 4.8 /100 | #227 | Tragic 94.4% |
| Lumbee | 4.7 /100 | #228 | Tragic 94.4% |
| Immigrants | Southern Europe | 4.5 /100 | #229 | Tragic 94.3% |
| Apache | 4.2 /100 | #230 | Tragic 94.3% |
| Immigrants | Panama | 4.0 /100 | #231 | Tragic 94.3% |
| Immigrants | Africa | 3.9 /100 | #232 | Tragic 94.3% |
| Nigerians | 3.7 /100 | #233 | Tragic 94.3% |
| Costa Ricans | 3.5 /100 | #234 | Tragic 94.3% |