Central American vs Celtic Bachelor's Degree
COMPARE
Central American
Celtic
Bachelor's Degree
Bachelor's Degree Comparison
Central Americans
Celtics
31.9%
BACHELOR'S DEGREE
0.2/ 100
METRIC RATING
271st/ 347
METRIC RANK
37.0%
BACHELOR'S DEGREE
29.5/ 100
METRIC RATING
196th/ 347
METRIC RANK
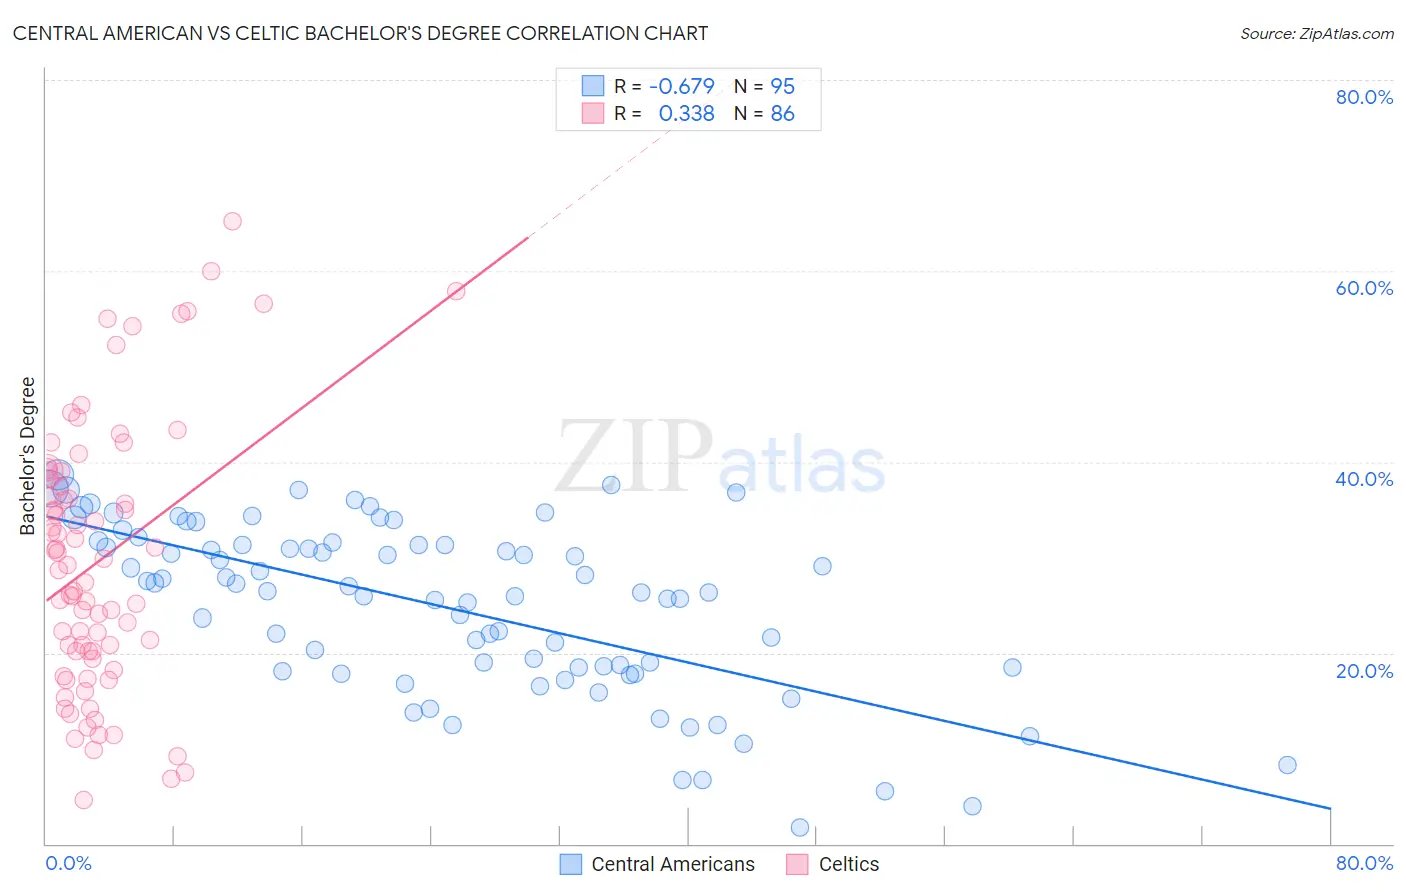
Central American vs Celtic Bachelor's Degree Correlation Chart
The statistical analysis conducted on geographies consisting of 504,521,400 people shows a significant negative correlation between the proportion of Central Americans and percentage of population with at least bachelor's degree education in the United States with a correlation coefficient (R) of -0.679 and weighted average of 31.9%. Similarly, the statistical analysis conducted on geographies consisting of 168,877,213 people shows a mild positive correlation between the proportion of Celtics and percentage of population with at least bachelor's degree education in the United States with a correlation coefficient (R) of 0.338 and weighted average of 37.0%, a difference of 16.0%.
Bachelor's Degree Correlation Summary
| Measurement | Central American | Celtic |
| Minimum | 1.7% | 4.5% |
| Maximum | 38.7% | 65.3% |
| Range | 37.0% | 60.7% |
| Mean | 24.8% | 29.6% |
| Median | 26.5% | 28.9% |
| Interquartile 25% (IQ1) | 18.4% | 20.1% |
| Interquartile 75% (IQ3) | 31.3% | 38.2% |
| Interquartile Range (IQR) | 12.9% | 18.1% |
| Standard Deviation (Sample) | 8.9% | 13.8% |
| Standard Deviation (Population) | 8.8% | 13.7% |
Similar Demographics by Bachelor's Degree
Demographics Similar to Central Americans by Bachelor's Degree
In terms of bachelor's degree, the demographic groups most similar to Central Americans are Comanche (31.9%, a difference of 0.030%), Immigrants from Nicaragua (31.9%, a difference of 0.090%), American (31.9%, a difference of 0.15%), Potawatomi (31.9%, a difference of 0.17%), and Samoan (31.8%, a difference of 0.30%).
| Demographics | Rating | Rank | Bachelor's Degree |
| Central American Indians | 0.3 /100 | #264 | Tragic 32.5% |
| Bahamians | 0.3 /100 | #265 | Tragic 32.5% |
| Immigrants | Dominica | 0.3 /100 | #266 | Tragic 32.5% |
| Cubans | 0.3 /100 | #267 | Tragic 32.5% |
| Immigrants | Portugal | 0.2 /100 | #268 | Tragic 32.2% |
| Immigrants | Belize | 0.2 /100 | #269 | Tragic 32.1% |
| Immigrants | Nicaragua | 0.2 /100 | #270 | Tragic 31.9% |
| Central Americans | 0.2 /100 | #271 | Tragic 31.9% |
| Comanche | 0.2 /100 | #272 | Tragic 31.9% |
| Americans | 0.2 /100 | #273 | Tragic 31.9% |
| Potawatomi | 0.2 /100 | #274 | Tragic 31.9% |
| Samoans | 0.1 /100 | #275 | Tragic 31.8% |
| Salvadorans | 0.1 /100 | #276 | Tragic 31.8% |
| Dominicans | 0.1 /100 | #277 | Tragic 31.8% |
| Marshallese | 0.1 /100 | #278 | Tragic 31.7% |
Demographics Similar to Celtics by Bachelor's Degree
In terms of bachelor's degree, the demographic groups most similar to Celtics are Korean (37.0%, a difference of 0.030%), Belgian (37.0%, a difference of 0.040%), Czechoslovakian (37.0%, a difference of 0.040%), Welsh (37.0%, a difference of 0.050%), and Yugoslavian (37.1%, a difference of 0.23%).
| Demographics | Rating | Rank | Bachelor's Degree |
| Slovaks | 36.9 /100 | #189 | Fair 37.3% |
| Swiss | 34.1 /100 | #190 | Fair 37.2% |
| Nigerians | 33.9 /100 | #191 | Fair 37.2% |
| Immigrants | Vietnam | 32.1 /100 | #192 | Fair 37.1% |
| Yugoslavians | 31.5 /100 | #193 | Fair 37.1% |
| Belgians | 29.9 /100 | #194 | Fair 37.0% |
| Koreans | 29.8 /100 | #195 | Fair 37.0% |
| Celtics | 29.5 /100 | #196 | Fair 37.0% |
| Czechoslovakians | 29.2 /100 | #197 | Fair 37.0% |
| Welsh | 29.1 /100 | #198 | Fair 37.0% |
| Immigrants | Costa Rica | 27.4 /100 | #199 | Fair 36.9% |
| Immigrants | Ghana | 27.4 /100 | #200 | Fair 36.9% |
| Immigrants | South Eastern Asia | 25.4 /100 | #201 | Fair 36.8% |
| Immigrants | Zaire | 25.3 /100 | #202 | Fair 36.8% |
| Immigrants | Nigeria | 23.1 /100 | #203 | Fair 36.7% |