Central American vs Immigrants from Brazil Bachelor's Degree
COMPARE
Central American
Immigrants from Brazil
Bachelor's Degree
Bachelor's Degree Comparison
Central Americans
Immigrants from Brazil
31.9%
BACHELOR'S DEGREE
0.2/ 100
METRIC RATING
271st/ 347
METRIC RANK
42.2%
BACHELOR'S DEGREE
99.2/ 100
METRIC RATING
86th/ 347
METRIC RANK
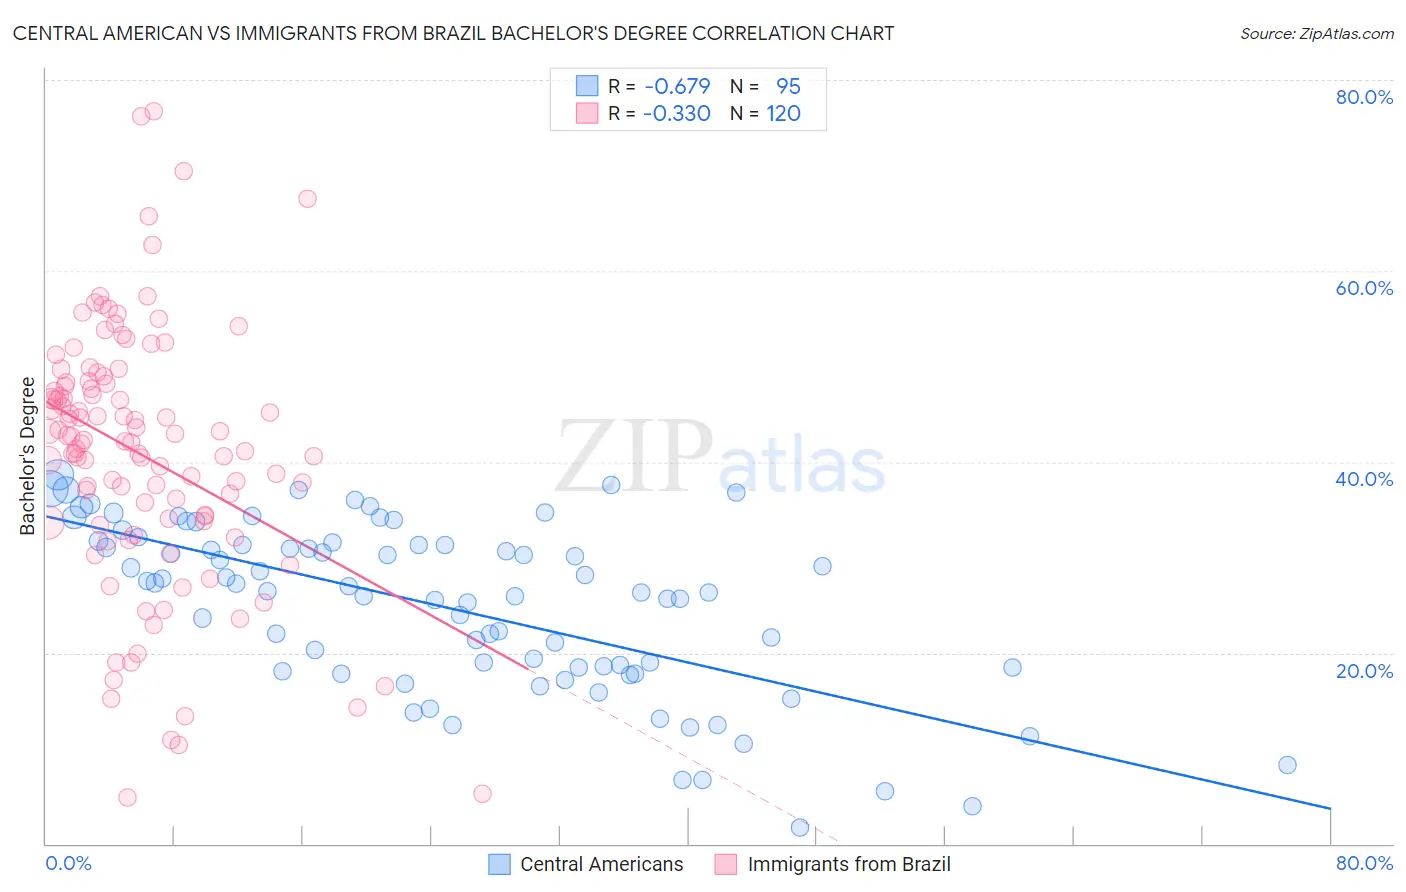
Central American vs Immigrants from Brazil Bachelor's Degree Correlation Chart
The statistical analysis conducted on geographies consisting of 504,521,400 people shows a significant negative correlation between the proportion of Central Americans and percentage of population with at least bachelor's degree education in the United States with a correlation coefficient (R) of -0.679 and weighted average of 31.9%. Similarly, the statistical analysis conducted on geographies consisting of 342,997,196 people shows a mild negative correlation between the proportion of Immigrants from Brazil and percentage of population with at least bachelor's degree education in the United States with a correlation coefficient (R) of -0.330 and weighted average of 42.2%, a difference of 32.3%.
Bachelor's Degree Correlation Summary
| Measurement | Central American | Immigrants from Brazil |
| Minimum | 1.7% | 4.8% |
| Maximum | 38.7% | 76.8% |
| Range | 37.0% | 72.0% |
| Mean | 24.8% | 40.8% |
| Median | 26.5% | 42.2% |
| Interquartile 25% (IQ1) | 18.4% | 33.9% |
| Interquartile 75% (IQ3) | 31.3% | 48.3% |
| Interquartile Range (IQR) | 12.9% | 14.3% |
| Standard Deviation (Sample) | 8.9% | 13.5% |
| Standard Deviation (Population) | 8.8% | 13.5% |
Similar Demographics by Bachelor's Degree
Demographics Similar to Central Americans by Bachelor's Degree
In terms of bachelor's degree, the demographic groups most similar to Central Americans are Comanche (31.9%, a difference of 0.030%), Immigrants from Nicaragua (31.9%, a difference of 0.090%), American (31.9%, a difference of 0.15%), Potawatomi (31.9%, a difference of 0.17%), and Samoan (31.8%, a difference of 0.30%).
| Demographics | Rating | Rank | Bachelor's Degree |
| Central American Indians | 0.3 /100 | #264 | Tragic 32.5% |
| Bahamians | 0.3 /100 | #265 | Tragic 32.5% |
| Immigrants | Dominica | 0.3 /100 | #266 | Tragic 32.5% |
| Cubans | 0.3 /100 | #267 | Tragic 32.5% |
| Immigrants | Portugal | 0.2 /100 | #268 | Tragic 32.2% |
| Immigrants | Belize | 0.2 /100 | #269 | Tragic 32.1% |
| Immigrants | Nicaragua | 0.2 /100 | #270 | Tragic 31.9% |
| Central Americans | 0.2 /100 | #271 | Tragic 31.9% |
| Comanche | 0.2 /100 | #272 | Tragic 31.9% |
| Americans | 0.2 /100 | #273 | Tragic 31.9% |
| Potawatomi | 0.2 /100 | #274 | Tragic 31.9% |
| Samoans | 0.1 /100 | #275 | Tragic 31.8% |
| Salvadorans | 0.1 /100 | #276 | Tragic 31.8% |
| Dominicans | 0.1 /100 | #277 | Tragic 31.8% |
| Marshallese | 0.1 /100 | #278 | Tragic 31.7% |
Demographics Similar to Immigrants from Brazil by Bachelor's Degree
In terms of bachelor's degree, the demographic groups most similar to Immigrants from Brazil are Lithuanian (42.2%, a difference of 0.080%), Immigrants from Western Asia (42.3%, a difference of 0.11%), Armenian (42.3%, a difference of 0.12%), Immigrants from Scotland (42.3%, a difference of 0.15%), and Immigrants from Hungary (42.3%, a difference of 0.22%).
| Demographics | Rating | Rank | Bachelor's Degree |
| Immigrants | Lebanon | 99.3 /100 | #79 | Exceptional 42.4% |
| Immigrants | Croatia | 99.2 /100 | #80 | Exceptional 42.3% |
| Immigrants | Hungary | 99.2 /100 | #81 | Exceptional 42.3% |
| Immigrants | Scotland | 99.2 /100 | #82 | Exceptional 42.3% |
| Armenians | 99.2 /100 | #83 | Exceptional 42.3% |
| Immigrants | Western Asia | 99.2 /100 | #84 | Exceptional 42.3% |
| Lithuanians | 99.2 /100 | #85 | Exceptional 42.2% |
| Immigrants | Brazil | 99.2 /100 | #86 | Exceptional 42.2% |
| Carpatho Rusyns | 99.0 /100 | #87 | Exceptional 42.1% |
| Immigrants | Western Europe | 99.0 /100 | #88 | Exceptional 42.0% |
| Greeks | 99.0 /100 | #89 | Exceptional 42.0% |
| Laotians | 98.9 /100 | #90 | Exceptional 42.0% |
| Immigrants | Northern Africa | 98.9 /100 | #91 | Exceptional 41.9% |
| Maltese | 98.8 /100 | #92 | Exceptional 41.9% |
| Immigrants | Canada | 98.6 /100 | #93 | Exceptional 41.7% |