Central American vs African No Schooling Completed
COMPARE
Central American
African
No Schooling Completed
No Schooling Completed Comparison
Central Americans
Africans
3.4%
NO SCHOOLING COMPLETED
0.0/ 100
METRIC RATING
332nd/ 347
METRIC RANK
2.2%
NO SCHOOLING COMPLETED
21.8/ 100
METRIC RATING
199th/ 347
METRIC RANK
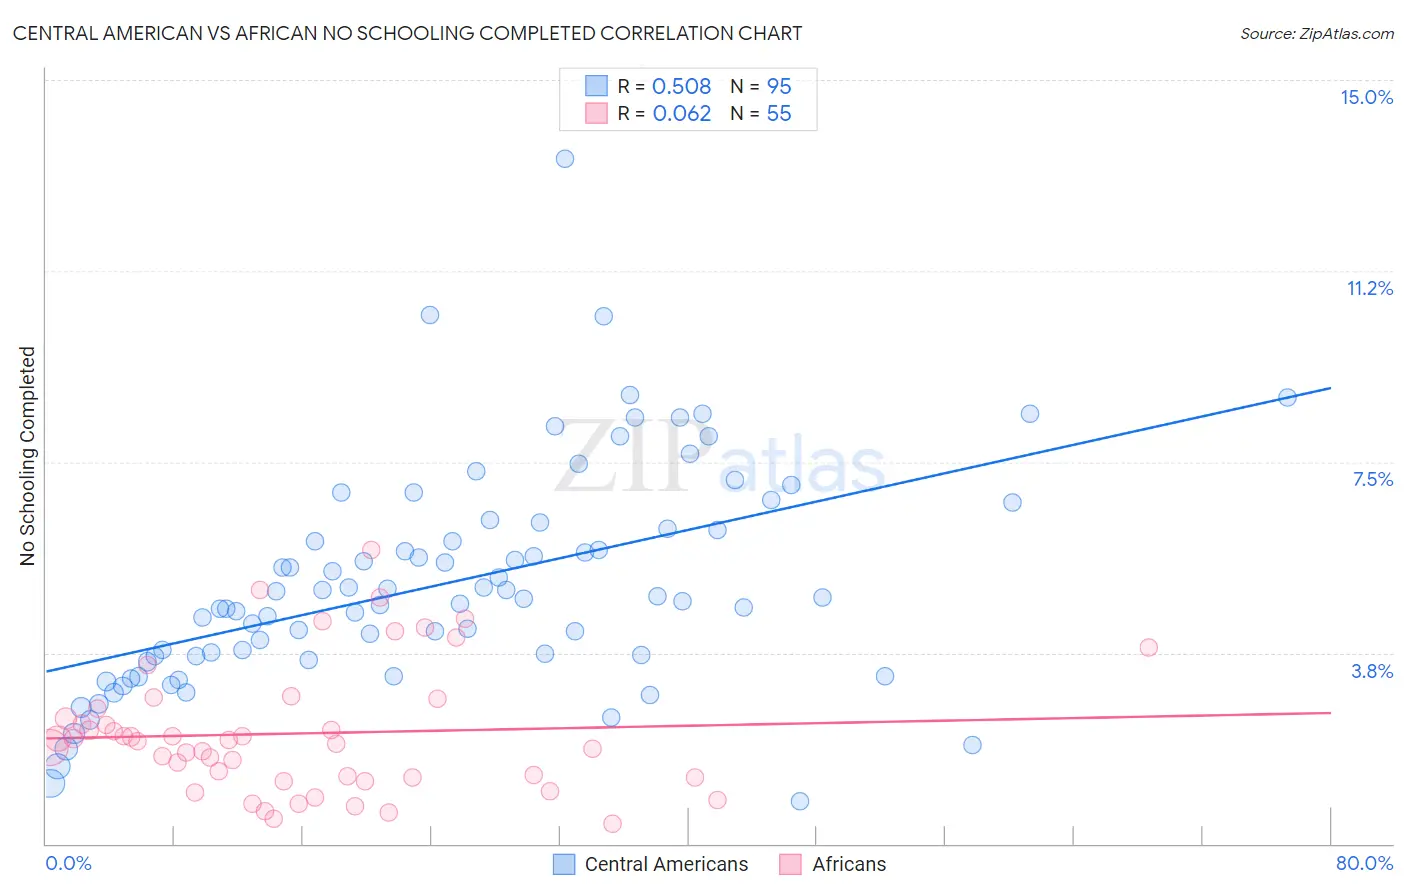
Central American vs African No Schooling Completed Correlation Chart
The statistical analysis conducted on geographies consisting of 497,423,122 people shows a substantial positive correlation between the proportion of Central Americans and percentage of population with no schooling in the United States with a correlation coefficient (R) of 0.508 and weighted average of 3.4%. Similarly, the statistical analysis conducted on geographies consisting of 465,007,886 people shows a slight positive correlation between the proportion of Africans and percentage of population with no schooling in the United States with a correlation coefficient (R) of 0.062 and weighted average of 2.2%, a difference of 55.8%.
No Schooling Completed Correlation Summary
| Measurement | Central American | African |
| Minimum | 0.83% | 0.39% |
| Maximum | 13.5% | 5.8% |
| Range | 12.6% | 5.4% |
| Mean | 5.1% | 2.2% |
| Median | 4.8% | 2.0% |
| Interquartile 25% (IQ1) | 3.7% | 1.3% |
| Interquartile 75% (IQ3) | 6.2% | 2.7% |
| Interquartile Range (IQR) | 2.5% | 1.4% |
| Standard Deviation (Sample) | 2.2% | 1.3% |
| Standard Deviation (Population) | 2.1% | 1.2% |
Similar Demographics by No Schooling Completed
Demographics Similar to Central Americans by No Schooling Completed
In terms of no schooling completed, the demographic groups most similar to Central Americans are Immigrants from Dominican Republic (3.4%, a difference of 0.060%), Japanese (3.3%, a difference of 1.5%), Immigrants from Armenia (3.3%, a difference of 1.5%), Guatemalan (3.5%, a difference of 1.8%), and Immigrants from Vietnam (3.3%, a difference of 2.0%).
| Demographics | Rating | Rank | No Schooling Completed |
| Dominicans | 0.0 /100 | #325 | Tragic 3.2% |
| Indonesians | 0.0 /100 | #326 | Tragic 3.2% |
| Immigrants | Latin America | 0.0 /100 | #327 | Tragic 3.3% |
| Mexicans | 0.0 /100 | #328 | Tragic 3.3% |
| Immigrants | Vietnam | 0.0 /100 | #329 | Tragic 3.3% |
| Immigrants | Armenia | 0.0 /100 | #330 | Tragic 3.3% |
| Japanese | 0.0 /100 | #331 | Tragic 3.3% |
| Central Americans | 0.0 /100 | #332 | Tragic 3.4% |
| Immigrants | Dominican Republic | 0.0 /100 | #333 | Tragic 3.4% |
| Guatemalans | 0.0 /100 | #334 | Tragic 3.5% |
| Immigrants | Cambodia | 0.0 /100 | #335 | Tragic 3.5% |
| Immigrants | Fiji | 0.0 /100 | #336 | Tragic 3.5% |
| Immigrants | Cabo Verde | 0.0 /100 | #337 | Tragic 3.5% |
| Bangladeshis | 0.0 /100 | #338 | Tragic 3.5% |
| Yakama | 0.0 /100 | #339 | Tragic 3.6% |
Demographics Similar to Africans by No Schooling Completed
In terms of no schooling completed, the demographic groups most similar to Africans are Immigrants from Chile (2.2%, a difference of 0.17%), Immigrants from Southern Europe (2.2%, a difference of 0.35%), Immigrants from Northern Africa (2.2%, a difference of 0.46%), Immigrants from Ukraine (2.2%, a difference of 0.77%), and Hawaiian (2.2%, a difference of 0.92%).
| Demographics | Rating | Rank | No Schooling Completed |
| Guamanians/Chamorros | 29.8 /100 | #192 | Fair 2.2% |
| Paraguayans | 29.3 /100 | #193 | Fair 2.2% |
| Immigrants | Albania | 28.3 /100 | #194 | Fair 2.2% |
| Hawaiians | 27.0 /100 | #195 | Fair 2.2% |
| Immigrants | Ukraine | 26.1 /100 | #196 | Fair 2.2% |
| Immigrants | Southern Europe | 23.8 /100 | #197 | Fair 2.2% |
| Immigrants | Chile | 22.7 /100 | #198 | Fair 2.2% |
| Africans | 21.8 /100 | #199 | Fair 2.2% |
| Immigrants | Northern Africa | 19.5 /100 | #200 | Poor 2.2% |
| Costa Ricans | 17.1 /100 | #201 | Poor 2.2% |
| Moroccans | 13.7 /100 | #202 | Poor 2.2% |
| Laotians | 13.3 /100 | #203 | Poor 2.2% |
| Hopi | 12.9 /100 | #204 | Poor 2.2% |
| Immigrants | Bahamas | 11.6 /100 | #205 | Poor 2.2% |
| Bahamians | 11.6 /100 | #206 | Poor 2.2% |