Swedish vs Japanese 2nd Grade
COMPARE
Swedish
Japanese
2nd Grade
2nd Grade Comparison
Swedes
Japanese
98.6%
2ND GRADE
100.0/ 100
METRIC RATING
14th/ 347
METRIC RANK
96.5%
2ND GRADE
0.0/ 100
METRIC RATING
329th/ 347
METRIC RANK
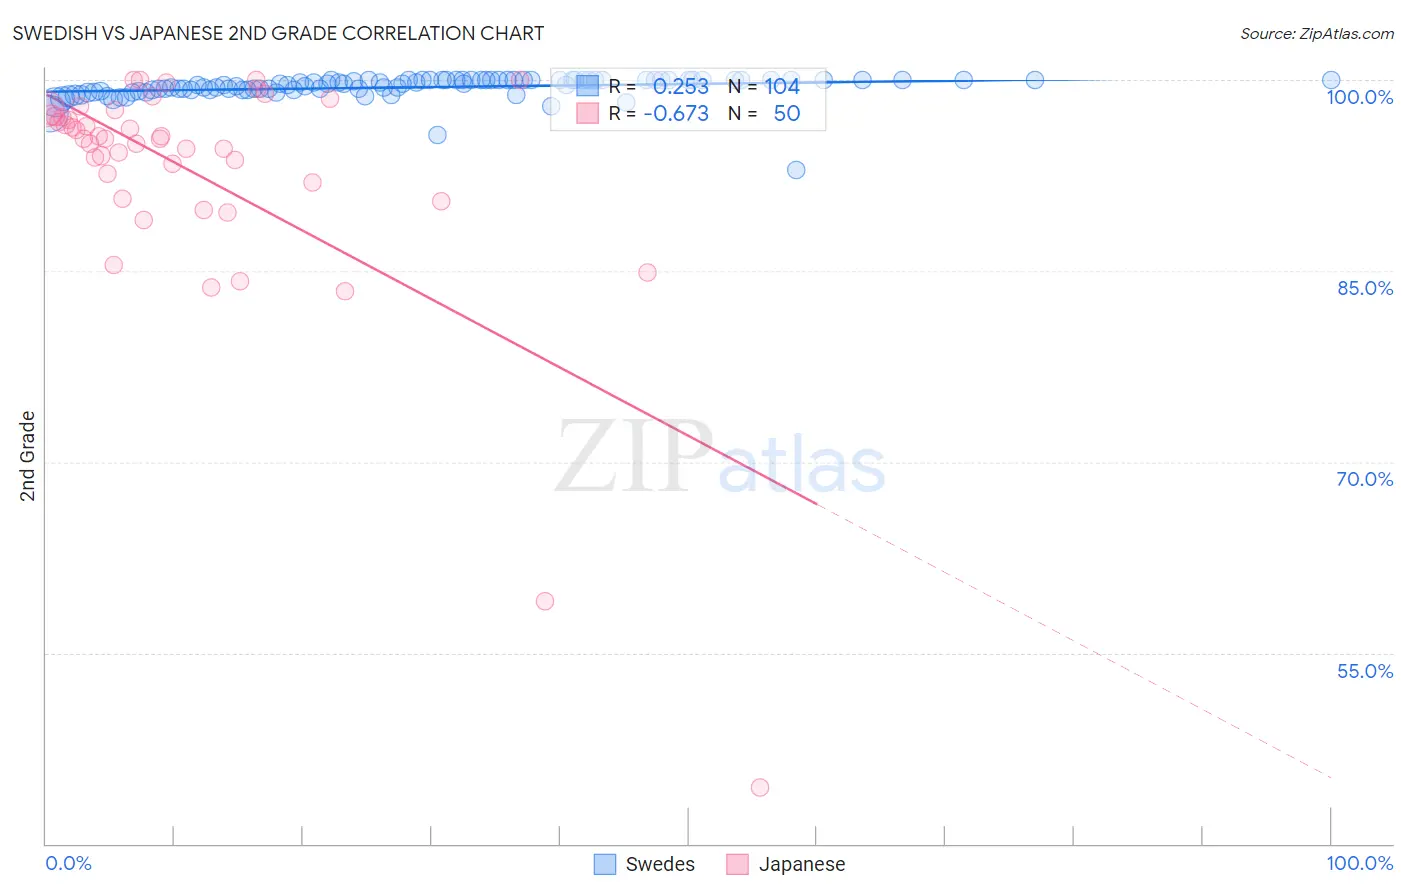
Swedish vs Japanese 2nd Grade Correlation Chart
The statistical analysis conducted on geographies consisting of 539,231,492 people shows a weak positive correlation between the proportion of Swedes and percentage of population with at least 2nd grade education in the United States with a correlation coefficient (R) of 0.253 and weighted average of 98.6%. Similarly, the statistical analysis conducted on geographies consisting of 249,183,224 people shows a significant negative correlation between the proportion of Japanese and percentage of population with at least 2nd grade education in the United States with a correlation coefficient (R) of -0.673 and weighted average of 96.5%, a difference of 2.1%.
2nd Grade Correlation Summary
| Measurement | Swedish | Japanese |
| Minimum | 92.9% | 44.4% |
| Maximum | 100.0% | 100.0% |
| Range | 7.1% | 55.6% |
| Mean | 99.4% | 92.8% |
| Median | 99.7% | 95.4% |
| Interquartile 25% (IQ1) | 99.2% | 92.0% |
| Interquartile 75% (IQ3) | 100.0% | 97.2% |
| Interquartile Range (IQR) | 0.81% | 5.2% |
| Standard Deviation (Sample) | 0.93% | 9.7% |
| Standard Deviation (Population) | 0.92% | 9.6% |
Similar Demographics by 2nd Grade
Demographics Similar to Swedes by 2nd Grade
In terms of 2nd grade, the demographic groups most similar to Swedes are English (98.6%, a difference of 0.010%), Tlingit-Haida (98.6%, a difference of 0.020%), Carpatho Rusyn (98.6%, a difference of 0.020%), Scottish (98.6%, a difference of 0.020%), and Dutch (98.6%, a difference of 0.020%).
| Demographics | Rating | Rank | 2nd Grade |
| Norwegians | 100.0 /100 | #7 | Exceptional 98.7% |
| Germans | 100.0 /100 | #8 | Exceptional 98.7% |
| Slovaks | 100.0 /100 | #9 | Exceptional 98.7% |
| Slovenes | 100.0 /100 | #10 | Exceptional 98.6% |
| Tlingit-Haida | 100.0 /100 | #11 | Exceptional 98.6% |
| Carpatho Rusyns | 100.0 /100 | #12 | Exceptional 98.6% |
| English | 100.0 /100 | #13 | Exceptional 98.6% |
| Swedes | 100.0 /100 | #14 | Exceptional 98.6% |
| Scottish | 100.0 /100 | #15 | Exceptional 98.6% |
| Dutch | 100.0 /100 | #16 | Exceptional 98.6% |
| Aleuts | 100.0 /100 | #17 | Exceptional 98.6% |
| Irish | 100.0 /100 | #18 | Exceptional 98.6% |
| Finns | 100.0 /100 | #19 | Exceptional 98.5% |
| Sioux | 100.0 /100 | #20 | Exceptional 98.5% |
| Lithuanians | 100.0 /100 | #21 | Exceptional 98.5% |
Demographics Similar to Japanese by 2nd Grade
In terms of 2nd grade, the demographic groups most similar to Japanese are Mexican (96.5%, a difference of 0.0%), Immigrants from Vietnam (96.5%, a difference of 0.010%), Immigrants from Latin America (96.5%, a difference of 0.010%), Immigrants from Armenia (96.5%, a difference of 0.040%), and Bangladeshi (96.5%, a difference of 0.060%).
| Demographics | Rating | Rank | 2nd Grade |
| Immigrants | Bangladesh | 0.0 /100 | #322 | Tragic 96.7% |
| Vietnamese | 0.0 /100 | #323 | Tragic 96.7% |
| Mexican American Indians | 0.0 /100 | #324 | Tragic 96.7% |
| Dominicans | 0.0 /100 | #325 | Tragic 96.6% |
| Immigrants | Honduras | 0.0 /100 | #326 | Tragic 96.6% |
| Immigrants | Vietnam | 0.0 /100 | #327 | Tragic 96.5% |
| Mexicans | 0.0 /100 | #328 | Tragic 96.5% |
| Japanese | 0.0 /100 | #329 | Tragic 96.5% |
| Immigrants | Latin America | 0.0 /100 | #330 | Tragic 96.5% |
| Immigrants | Armenia | 0.0 /100 | #331 | Tragic 96.5% |
| Bangladeshis | 0.0 /100 | #332 | Tragic 96.5% |
| Immigrants | Dominican Republic | 0.0 /100 | #333 | Tragic 96.4% |
| Central Americans | 0.0 /100 | #334 | Tragic 96.4% |
| Yakama | 0.0 /100 | #335 | Tragic 96.4% |
| Immigrants | Fiji | 0.0 /100 | #336 | Tragic 96.4% |