Central American Indian vs Canadian 9th Grade
COMPARE
Central American Indian
Canadian
9th Grade
9th Grade Comparison
Central American Indians
Canadians
91.5%
9TH GRADE
0.0/ 100
METRIC RATING
325th/ 347
METRIC RANK
95.9%
9TH GRADE
99.7/ 100
METRIC RATING
63rd/ 347
METRIC RANK
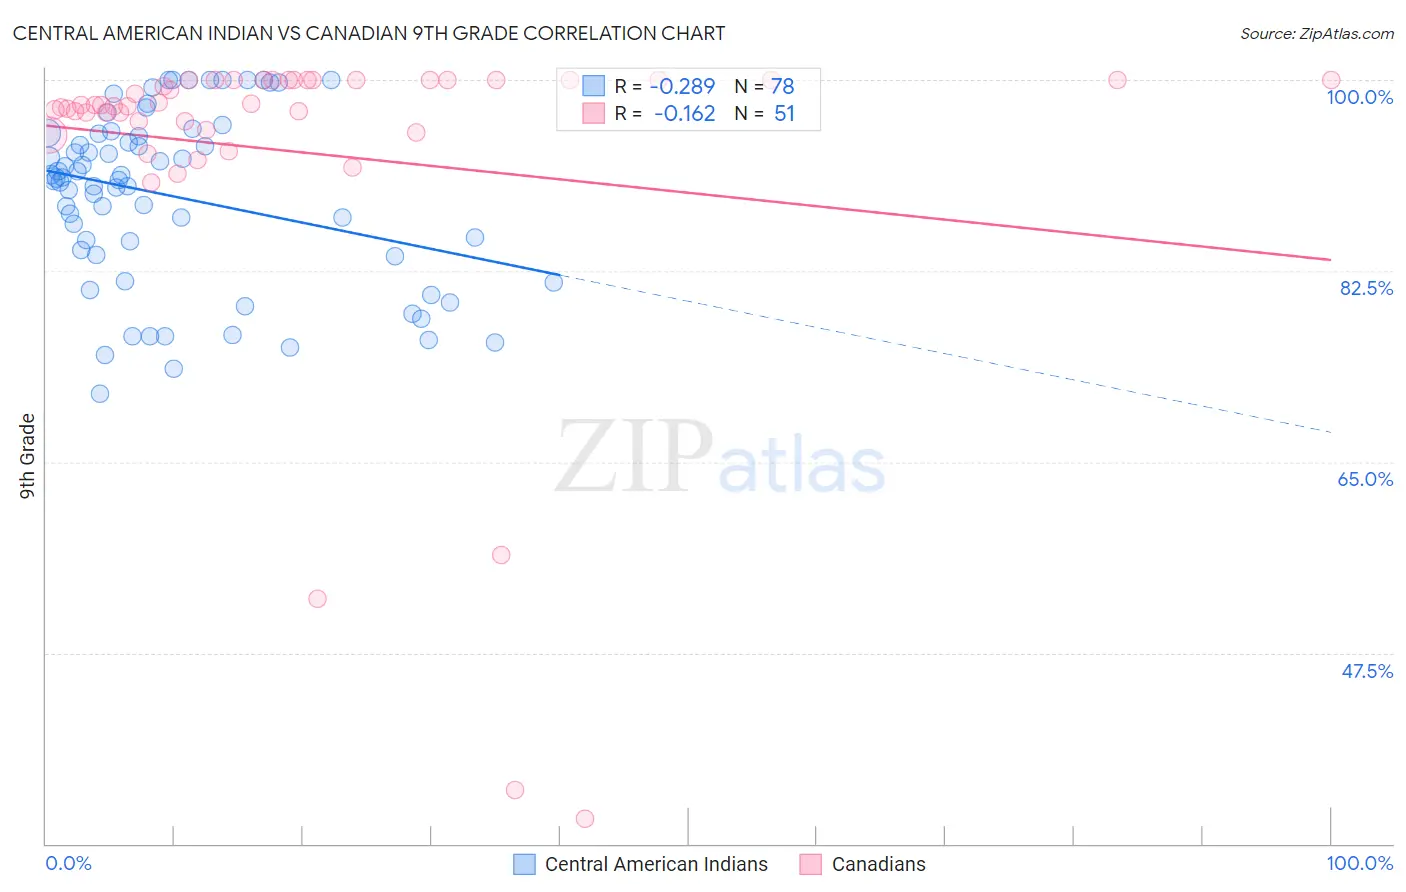
Central American Indian vs Canadian 9th Grade Correlation Chart
The statistical analysis conducted on geographies consisting of 326,142,359 people shows a weak negative correlation between the proportion of Central American Indians and percentage of population with at least 9th grade education in the United States with a correlation coefficient (R) of -0.289 and weighted average of 91.5%. Similarly, the statistical analysis conducted on geographies consisting of 437,556,705 people shows a poor negative correlation between the proportion of Canadians and percentage of population with at least 9th grade education in the United States with a correlation coefficient (R) of -0.162 and weighted average of 95.9%, a difference of 4.8%.
9th Grade Correlation Summary
| Measurement | Central American Indian | Canadian |
| Minimum | 71.2% | 32.3% |
| Maximum | 100.0% | 100.0% |
| Range | 28.8% | 67.7% |
| Mean | 89.3% | 93.4% |
| Median | 90.9% | 97.7% |
| Interquartile 25% (IQ1) | 84.0% | 95.4% |
| Interquartile 75% (IQ3) | 95.1% | 100.0% |
| Interquartile Range (IQR) | 11.1% | 4.6% |
| Standard Deviation (Sample) | 7.9% | 15.1% |
| Standard Deviation (Population) | 7.8% | 14.9% |
Similar Demographics by 9th Grade
Demographics Similar to Central American Indians by 9th Grade
In terms of 9th grade, the demographic groups most similar to Central American Indians are Immigrants from Armenia (91.4%, a difference of 0.10%), Immigrants from Nicaragua (91.3%, a difference of 0.15%), Immigrants from Belize (91.8%, a difference of 0.33%), Belizean (91.8%, a difference of 0.39%), and Puerto Rican (91.8%, a difference of 0.39%).
| Demographics | Rating | Rank | 9th Grade |
| Nepalese | 0.0 /100 | #318 | Tragic 92.0% |
| Ecuadorians | 0.0 /100 | #319 | Tragic 91.9% |
| Nicaraguans | 0.0 /100 | #320 | Tragic 91.9% |
| Immigrants | Ecuador | 0.0 /100 | #321 | Tragic 91.8% |
| Belizeans | 0.0 /100 | #322 | Tragic 91.8% |
| Puerto Ricans | 0.0 /100 | #323 | Tragic 91.8% |
| Immigrants | Belize | 0.0 /100 | #324 | Tragic 91.8% |
| Central American Indians | 0.0 /100 | #325 | Tragic 91.5% |
| Immigrants | Armenia | 0.0 /100 | #326 | Tragic 91.4% |
| Immigrants | Nicaragua | 0.0 /100 | #327 | Tragic 91.3% |
| Dominicans | 0.0 /100 | #328 | Tragic 91.1% |
| Hondurans | 0.0 /100 | #329 | Tragic 91.0% |
| Immigrants | Cabo Verde | 0.0 /100 | #330 | Tragic 90.9% |
| Mexican American Indians | 0.0 /100 | #331 | Tragic 90.9% |
| Hispanics or Latinos | 0.0 /100 | #332 | Tragic 90.9% |
Demographics Similar to Canadians by 9th Grade
In terms of 9th grade, the demographic groups most similar to Canadians are Zimbabwean (95.9%, a difference of 0.010%), Immigrants from England (95.9%, a difference of 0.020%), Ukrainian (95.9%, a difference of 0.040%), Immigrants from Netherlands (95.8%, a difference of 0.040%), and Cypriot (95.8%, a difference of 0.040%).
| Demographics | Rating | Rank | 9th Grade |
| Immigrants | North America | 99.8 /100 | #56 | Exceptional 96.0% |
| Macedonians | 99.8 /100 | #57 | Exceptional 96.0% |
| Aleuts | 99.8 /100 | #58 | Exceptional 96.0% |
| New Zealanders | 99.8 /100 | #59 | Exceptional 95.9% |
| Native Hawaiians | 99.8 /100 | #60 | Exceptional 95.9% |
| Sioux | 99.8 /100 | #61 | Exceptional 95.9% |
| Ukrainians | 99.7 /100 | #62 | Exceptional 95.9% |
| Canadians | 99.7 /100 | #63 | Exceptional 95.9% |
| Zimbabweans | 99.7 /100 | #64 | Exceptional 95.9% |
| Immigrants | England | 99.6 /100 | #65 | Exceptional 95.9% |
| Immigrants | Netherlands | 99.6 /100 | #66 | Exceptional 95.8% |
| Cypriots | 99.6 /100 | #67 | Exceptional 95.8% |
| Immigrants | Ireland | 99.6 /100 | #68 | Exceptional 95.8% |
| Immigrants | Lithuania | 99.6 /100 | #69 | Exceptional 95.8% |
| Immigrants | Australia | 99.5 /100 | #70 | Exceptional 95.8% |