Carpatho Rusyn vs Ghanaian High School Diploma
COMPARE
Carpatho Rusyn
Ghanaian
High School Diploma
High School Diploma Comparison
Carpatho Rusyns
Ghanaians
92.1%
HIGH SCHOOL DIPLOMA
100.0/ 100
METRIC RATING
3rd/ 347
METRIC RANK
87.7%
HIGH SCHOOL DIPLOMA
1.4/ 100
METRIC RATING
251st/ 347
METRIC RANK
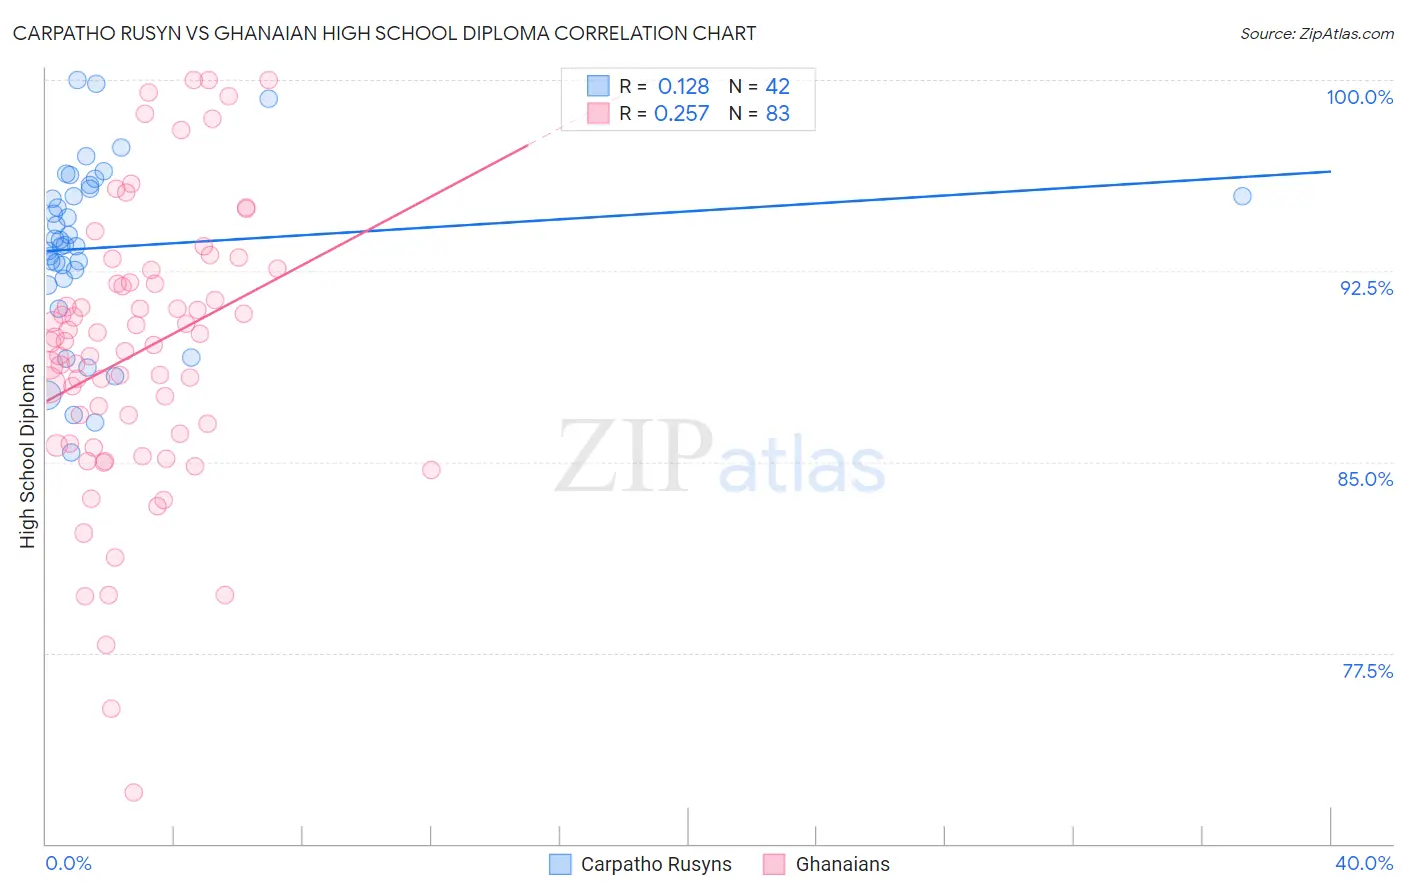
Carpatho Rusyn vs Ghanaian High School Diploma Correlation Chart
The statistical analysis conducted on geographies consisting of 58,871,690 people shows a poor positive correlation between the proportion of Carpatho Rusyns and percentage of population with at least high school diploma education in the United States with a correlation coefficient (R) of 0.128 and weighted average of 92.1%. Similarly, the statistical analysis conducted on geographies consisting of 190,714,079 people shows a weak positive correlation between the proportion of Ghanaians and percentage of population with at least high school diploma education in the United States with a correlation coefficient (R) of 0.257 and weighted average of 87.7%, a difference of 5.0%.
High School Diploma Correlation Summary
| Measurement | Carpatho Rusyn | Ghanaian |
| Minimum | 85.4% | 72.0% |
| Maximum | 100.0% | 100.0% |
| Range | 14.6% | 28.0% |
| Mean | 93.4% | 89.3% |
| Median | 93.6% | 89.7% |
| Interquartile 25% (IQ1) | 92.2% | 85.7% |
| Interquartile 75% (IQ3) | 95.7% | 92.1% |
| Interquartile Range (IQR) | 3.5% | 6.3% |
| Standard Deviation (Sample) | 3.5% | 5.5% |
| Standard Deviation (Population) | 3.4% | 5.5% |
Similar Demographics by High School Diploma
Demographics Similar to Carpatho Rusyns by High School Diploma
In terms of high school diploma, the demographic groups most similar to Carpatho Rusyns are Lithuanian (92.0%, a difference of 0.060%), Slovene (92.0%, a difference of 0.060%), Slovak (92.0%, a difference of 0.080%), Immigrants from India (92.0%, a difference of 0.090%), and Swedish (92.2%, a difference of 0.10%).
| Demographics | Rating | Rank | High School Diploma |
| Norwegians | 100.0 /100 | #1 | Exceptional 92.5% |
| Swedes | 100.0 /100 | #2 | Exceptional 92.2% |
| Carpatho Rusyns | 100.0 /100 | #3 | Exceptional 92.1% |
| Lithuanians | 100.0 /100 | #4 | Exceptional 92.0% |
| Slovenes | 100.0 /100 | #5 | Exceptional 92.0% |
| Slovaks | 100.0 /100 | #6 | Exceptional 92.0% |
| Immigrants | India | 100.0 /100 | #7 | Exceptional 92.0% |
| Chinese | 100.0 /100 | #8 | Exceptional 92.0% |
| Latvians | 100.0 /100 | #9 | Exceptional 92.0% |
| Croatians | 100.0 /100 | #10 | Exceptional 92.0% |
| Eastern Europeans | 100.0 /100 | #11 | Exceptional 91.9% |
| Poles | 100.0 /100 | #12 | Exceptional 91.9% |
| Danes | 100.0 /100 | #13 | Exceptional 91.8% |
| Bulgarians | 100.0 /100 | #14 | Exceptional 91.8% |
| Luxembourgers | 100.0 /100 | #15 | Exceptional 91.7% |
Demographics Similar to Ghanaians by High School Diploma
In terms of high school diploma, the demographic groups most similar to Ghanaians are Senegalese (87.7%, a difference of 0.040%), Immigrants from Nigeria (87.7%, a difference of 0.040%), Spanish American (87.7%, a difference of 0.050%), Immigrants from South America (87.6%, a difference of 0.060%), and Immigrants from Eritrea (87.8%, a difference of 0.090%).
| Demographics | Rating | Rank | High School Diploma |
| Choctaw | 1.9 /100 | #244 | Tragic 87.8% |
| Peruvians | 1.9 /100 | #245 | Tragic 87.8% |
| Immigrants | Eritrea | 1.7 /100 | #246 | Tragic 87.8% |
| Immigrants | Costa Rica | 1.7 /100 | #247 | Tragic 87.8% |
| Spanish Americans | 1.5 /100 | #248 | Tragic 87.7% |
| Senegalese | 1.5 /100 | #249 | Tragic 87.7% |
| Immigrants | Nigeria | 1.5 /100 | #250 | Tragic 87.7% |
| Ghanaians | 1.4 /100 | #251 | Tragic 87.7% |
| Immigrants | South America | 1.2 /100 | #252 | Tragic 87.6% |
| Immigrants | Uruguay | 1.0 /100 | #253 | Tragic 87.6% |
| Immigrants | Colombia | 1.0 /100 | #254 | Tragic 87.6% |
| Immigrants | Senegal | 0.9 /100 | #255 | Tragic 87.6% |
| Africans | 0.7 /100 | #256 | Tragic 87.5% |
| Bahamians | 0.7 /100 | #257 | Tragic 87.5% |
| Immigrants | Ghana | 0.5 /100 | #258 | Tragic 87.4% |