Immigrants from Ireland vs Immigrants from Latvia 4th Grade
COMPARE
Immigrants from Ireland
Immigrants from Latvia
4th Grade
4th Grade Comparison
Immigrants from Ireland
Immigrants from Latvia
97.9%
4TH GRADE
98.7/ 100
METRIC RATING
93rd/ 347
METRIC RANK
97.8%
4TH GRADE
96.8/ 100
METRIC RATING
109th/ 347
METRIC RANK
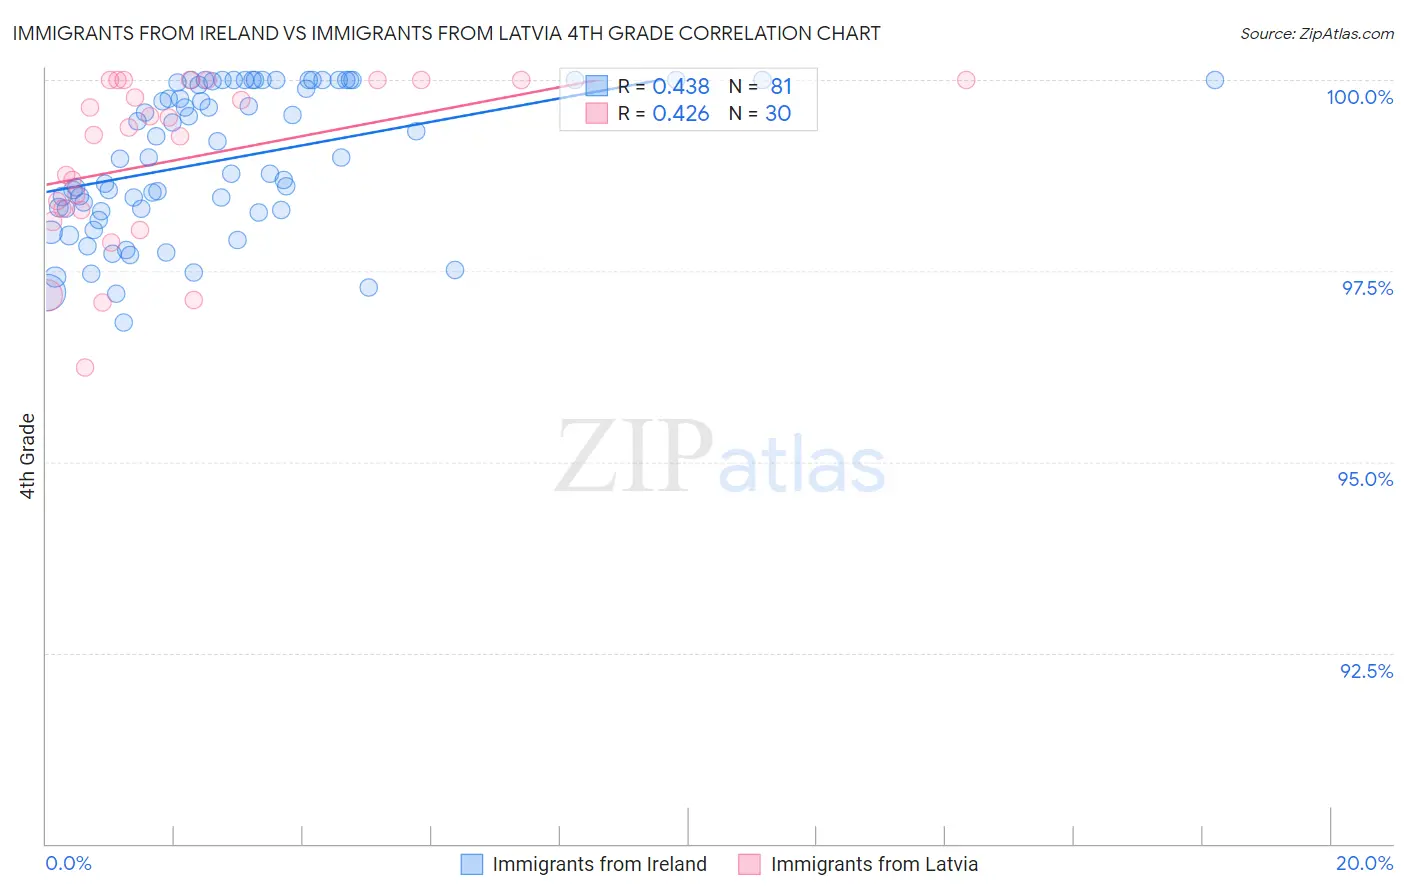
Immigrants from Ireland vs Immigrants from Latvia 4th Grade Correlation Chart
The statistical analysis conducted on geographies consisting of 240,784,498 people shows a moderate positive correlation between the proportion of Immigrants from Ireland and percentage of population with at least 4th grade education in the United States with a correlation coefficient (R) of 0.438 and weighted average of 97.9%. Similarly, the statistical analysis conducted on geographies consisting of 113,724,291 people shows a moderate positive correlation between the proportion of Immigrants from Latvia and percentage of population with at least 4th grade education in the United States with a correlation coefficient (R) of 0.426 and weighted average of 97.8%, a difference of 0.090%.
4th Grade Correlation Summary
| Measurement | Immigrants from Ireland | Immigrants from Latvia |
| Minimum | 96.8% | 96.2% |
| Maximum | 100.0% | 100.0% |
| Range | 3.2% | 3.8% |
| Mean | 99.0% | 99.0% |
| Median | 99.0% | 99.3% |
| Interquartile 25% (IQ1) | 98.3% | 98.3% |
| Interquartile 75% (IQ3) | 100.0% | 100.0% |
| Interquartile Range (IQR) | 1.7% | 1.7% |
| Standard Deviation (Sample) | 0.94% | 1.1% |
| Standard Deviation (Population) | 0.93% | 1.1% |
Demographics Similar to Immigrants from Ireland and Immigrants from Latvia by 4th Grade
In terms of 4th grade, the demographic groups most similar to Immigrants from Ireland are Immigrants from Sweden (97.9%, a difference of 0.0%), Immigrants from Western Europe (97.9%, a difference of 0.0%), Shoshone (97.9%, a difference of 0.0%), Immigrants from Germany (97.9%, a difference of 0.020%), and Romanian (97.9%, a difference of 0.020%). Similarly, the demographic groups most similar to Immigrants from Latvia are Thai (97.8%, a difference of 0.0%), Immigrants from Czechoslovakia (97.9%, a difference of 0.020%), Bhutanese (97.9%, a difference of 0.020%), Immigrants from Singapore (97.9%, a difference of 0.020%), and Immigrants from Switzerland (97.8%, a difference of 0.020%).
| Demographics | Rating | Rank | 4th Grade |
| Immigrants | Sweden | 98.7 /100 | #91 | Exceptional 97.9% |
| Immigrants | Western Europe | 98.7 /100 | #92 | Exceptional 97.9% |
| Immigrants | Ireland | 98.7 /100 | #93 | Exceptional 97.9% |
| Shoshone | 98.7 /100 | #94 | Exceptional 97.9% |
| Immigrants | Germany | 98.5 /100 | #95 | Exceptional 97.9% |
| Romanians | 98.4 /100 | #96 | Exceptional 97.9% |
| Cheyenne | 98.4 /100 | #97 | Exceptional 97.9% |
| South Africans | 98.2 /100 | #98 | Exceptional 97.9% |
| Turks | 98.2 /100 | #99 | Exceptional 97.9% |
| Yugoslavians | 98.1 /100 | #100 | Exceptional 97.9% |
| Cree | 98.1 /100 | #101 | Exceptional 97.9% |
| Choctaw | 97.9 /100 | #102 | Exceptional 97.9% |
| Puget Sound Salish | 97.7 /100 | #103 | Exceptional 97.9% |
| Immigrants | Nonimmigrants | 97.5 /100 | #104 | Exceptional 97.9% |
| German Russians | 97.5 /100 | #105 | Exceptional 97.9% |
| Immigrants | Czechoslovakia | 97.5 /100 | #106 | Exceptional 97.9% |
| Bhutanese | 97.4 /100 | #107 | Exceptional 97.9% |
| Immigrants | Singapore | 97.3 /100 | #108 | Exceptional 97.9% |
| Immigrants | Latvia | 96.8 /100 | #109 | Exceptional 97.8% |
| Thais | 96.7 /100 | #110 | Exceptional 97.8% |
| Immigrants | Switzerland | 96.1 /100 | #111 | Exceptional 97.8% |