Pueblo vs Moroccan High School Diploma
COMPARE
Pueblo
Moroccan
High School Diploma
High School Diploma Comparison
Pueblo
Moroccans
86.5%
HIGH SCHOOL DIPLOMA
0.0/ 100
METRIC RATING
280th/ 347
METRIC RANK
88.8%
HIGH SCHOOL DIPLOMA
29.5/ 100
METRIC RATING
192nd/ 347
METRIC RANK
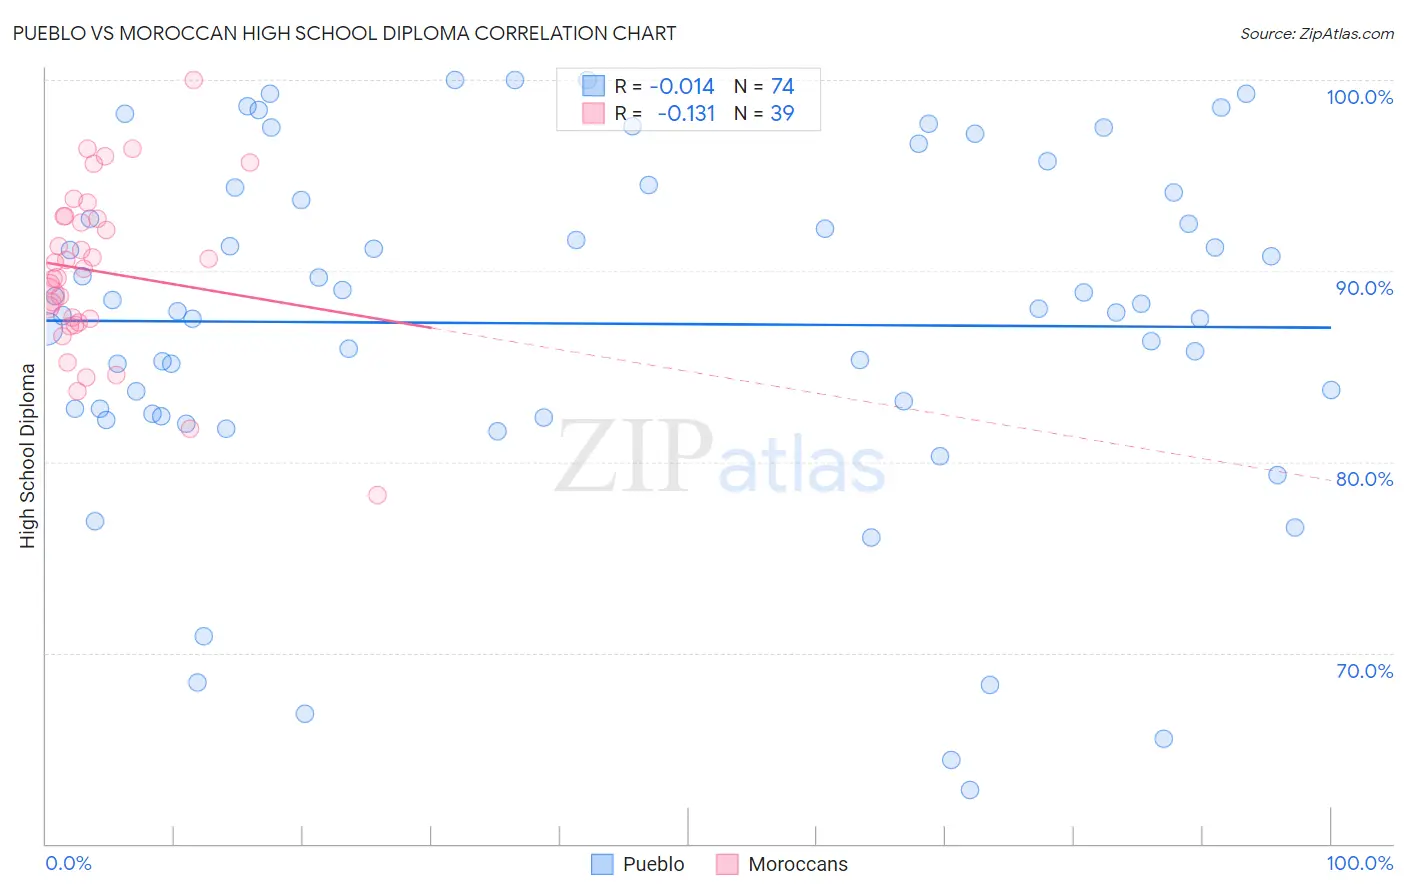
Pueblo vs Moroccan High School Diploma Correlation Chart
The statistical analysis conducted on geographies consisting of 120,086,593 people shows no correlation between the proportion of Pueblo and percentage of population with at least high school diploma education in the United States with a correlation coefficient (R) of -0.014 and weighted average of 86.5%. Similarly, the statistical analysis conducted on geographies consisting of 201,817,667 people shows a poor negative correlation between the proportion of Moroccans and percentage of population with at least high school diploma education in the United States with a correlation coefficient (R) of -0.131 and weighted average of 88.8%, a difference of 2.7%.
High School Diploma Correlation Summary
| Measurement | Pueblo | Moroccan |
| Minimum | 62.8% | 78.3% |
| Maximum | 100.0% | 100.0% |
| Range | 37.2% | 21.7% |
| Mean | 87.2% | 90.0% |
| Median | 88.0% | 90.1% |
| Interquartile 25% (IQ1) | 82.5% | 87.3% |
| Interquartile 75% (IQ3) | 94.1% | 92.9% |
| Interquartile Range (IQR) | 11.6% | 5.5% |
| Standard Deviation (Sample) | 9.1% | 4.4% |
| Standard Deviation (Population) | 9.1% | 4.3% |
Similar Demographics by High School Diploma
Demographics Similar to Pueblo by High School Diploma
In terms of high school diploma, the demographic groups most similar to Pueblo are Immigrants from Laos (86.6%, a difference of 0.020%), Indonesian (86.5%, a difference of 0.050%), Hopi (86.6%, a difference of 0.060%), Dutch West Indian (86.5%, a difference of 0.090%), and Immigrants from Barbados (86.4%, a difference of 0.15%).
| Demographics | Rating | Rank | High School Diploma |
| Immigrants | Jamaica | 0.1 /100 | #273 | Tragic 86.9% |
| Bangladeshis | 0.1 /100 | #274 | Tragic 86.9% |
| Immigrants | Trinidad and Tobago | 0.1 /100 | #275 | Tragic 86.8% |
| Immigrants | Burma/Myanmar | 0.1 /100 | #276 | Tragic 86.7% |
| Barbadians | 0.1 /100 | #277 | Tragic 86.7% |
| Hopi | 0.1 /100 | #278 | Tragic 86.6% |
| Immigrants | Laos | 0.0 /100 | #279 | Tragic 86.6% |
| Pueblo | 0.0 /100 | #280 | Tragic 86.5% |
| Indonesians | 0.0 /100 | #281 | Tragic 86.5% |
| Dutch West Indians | 0.0 /100 | #282 | Tragic 86.5% |
| Immigrants | Barbados | 0.0 /100 | #283 | Tragic 86.4% |
| Paiute | 0.0 /100 | #284 | Tragic 86.4% |
| Immigrants | West Indies | 0.0 /100 | #285 | Tragic 86.2% |
| Immigrants | St. Vincent and the Grenadines | 0.0 /100 | #286 | Tragic 86.2% |
| Ute | 0.0 /100 | #287 | Tragic 86.2% |
Demographics Similar to Moroccans by High School Diploma
In terms of high school diploma, the demographic groups most similar to Moroccans are Immigrants from Ethiopia (88.9%, a difference of 0.020%), Immigrants from Chile (88.9%, a difference of 0.040%), Immigrants from Uganda (88.9%, a difference of 0.050%), Immigrants from Oceania (88.8%, a difference of 0.050%), and Immigrants from Sudan (88.9%, a difference of 0.070%).
| Demographics | Rating | Rank | High School Diploma |
| Ethiopians | 37.0 /100 | #185 | Fair 89.0% |
| Immigrants | Eastern Africa | 35.8 /100 | #186 | Fair 88.9% |
| Guamanians/Chamorros | 35.5 /100 | #187 | Fair 88.9% |
| Immigrants | Sudan | 33.4 /100 | #188 | Fair 88.9% |
| Immigrants | Uganda | 32.6 /100 | #189 | Fair 88.9% |
| Immigrants | Chile | 31.9 /100 | #190 | Fair 88.9% |
| Immigrants | Ethiopia | 30.9 /100 | #191 | Fair 88.9% |
| Moroccans | 29.5 /100 | #192 | Fair 88.8% |
| Immigrants | Oceania | 26.9 /100 | #193 | Fair 88.8% |
| Immigrants | Venezuela | 25.8 /100 | #194 | Fair 88.8% |
| Afghans | 23.9 /100 | #195 | Fair 88.8% |
| Immigrants | Southern Europe | 23.4 /100 | #196 | Fair 88.7% |
| French American Indians | 21.5 /100 | #197 | Fair 88.7% |
| Liberians | 18.8 /100 | #198 | Poor 88.7% |
| Marshallese | 18.7 /100 | #199 | Poor 88.6% |