Cajun vs Syrian 7th Grade
COMPARE
Cajun
Syrian
7th Grade
7th Grade Comparison
Cajuns
Syrians
96.8%
7TH GRADE
99.5/ 100
METRIC RATING
72nd/ 347
METRIC RANK
96.5%
7TH GRADE
96.6/ 100
METRIC RATING
116th/ 347
METRIC RANK
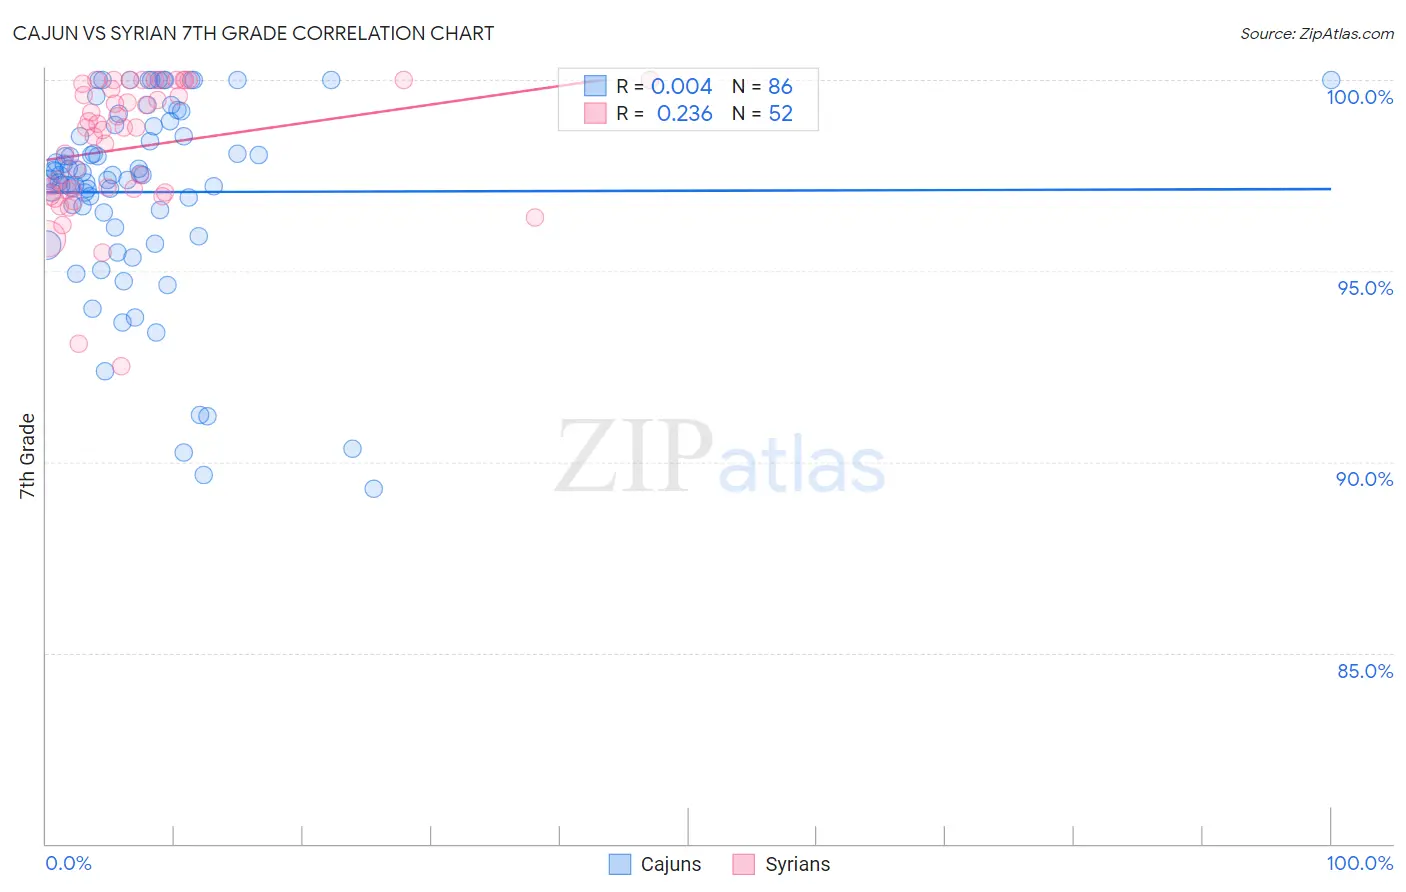
Cajun vs Syrian 7th Grade Correlation Chart
The statistical analysis conducted on geographies consisting of 149,712,957 people shows no correlation between the proportion of Cajuns and percentage of population with at least 7th grade education in the United States with a correlation coefficient (R) of 0.004 and weighted average of 96.8%. Similarly, the statistical analysis conducted on geographies consisting of 266,305,988 people shows a weak positive correlation between the proportion of Syrians and percentage of population with at least 7th grade education in the United States with a correlation coefficient (R) of 0.236 and weighted average of 96.5%, a difference of 0.31%.
7th Grade Correlation Summary
| Measurement | Cajun | Syrian |
| Minimum | 89.3% | 92.5% |
| Maximum | 100.0% | 100.0% |
| Range | 10.7% | 7.5% |
| Mean | 97.1% | 98.2% |
| Median | 97.5% | 98.8% |
| Interquartile 25% (IQ1) | 96.5% | 97.1% |
| Interquartile 75% (IQ3) | 98.8% | 99.8% |
| Interquartile Range (IQR) | 2.2% | 2.7% |
| Standard Deviation (Sample) | 2.5% | 1.7% |
| Standard Deviation (Population) | 2.5% | 1.7% |
Similar Demographics by 7th Grade
Demographics Similar to Cajuns by 7th Grade
In terms of 7th grade, the demographic groups most similar to Cajuns are New Zealander (96.8%, a difference of 0.010%), Immigrants from Lithuania (96.8%, a difference of 0.010%), Arapaho (96.8%, a difference of 0.010%), Iranian (96.8%, a difference of 0.020%), and Immigrants from England (96.8%, a difference of 0.030%).
| Demographics | Rating | Rank | 7th Grade |
| Canadians | 99.7 /100 | #65 | Exceptional 96.9% |
| Ukrainians | 99.7 /100 | #66 | Exceptional 96.9% |
| Native Hawaiians | 99.7 /100 | #67 | Exceptional 96.9% |
| Immigrants | India | 99.6 /100 | #68 | Exceptional 96.9% |
| Iranians | 99.6 /100 | #69 | Exceptional 96.8% |
| New Zealanders | 99.6 /100 | #70 | Exceptional 96.8% |
| Immigrants | Lithuania | 99.6 /100 | #71 | Exceptional 96.8% |
| Cajuns | 99.5 /100 | #72 | Exceptional 96.8% |
| Arapaho | 99.5 /100 | #73 | Exceptional 96.8% |
| Immigrants | England | 99.5 /100 | #74 | Exceptional 96.8% |
| Zimbabweans | 99.5 /100 | #75 | Exceptional 96.8% |
| Immigrants | Ireland | 99.4 /100 | #76 | Exceptional 96.8% |
| Cherokee | 99.4 /100 | #77 | Exceptional 96.8% |
| Immigrants | Netherlands | 99.3 /100 | #78 | Exceptional 96.8% |
| Cypriots | 99.3 /100 | #79 | Exceptional 96.8% |
Demographics Similar to Syrians by 7th Grade
In terms of 7th grade, the demographic groups most similar to Syrians are Immigrants from Zimbabwe (96.5%, a difference of 0.0%), Choctaw (96.5%, a difference of 0.0%), Pueblo (96.5%, a difference of 0.010%), Nonimmigrants (96.5%, a difference of 0.020%), and Okinawan (96.6%, a difference of 0.040%).
| Demographics | Rating | Rank | 7th Grade |
| Bhutanese | 97.7 /100 | #109 | Exceptional 96.6% |
| Okinawans | 97.4 /100 | #110 | Exceptional 96.6% |
| Immigrants | Latvia | 97.4 /100 | #111 | Exceptional 96.6% |
| Immigrants | Nonimmigrants | 97.0 /100 | #112 | Exceptional 96.5% |
| Pueblo | 96.8 /100 | #113 | Exceptional 96.5% |
| Immigrants | Zimbabwe | 96.6 /100 | #114 | Exceptional 96.5% |
| Choctaw | 96.6 /100 | #115 | Exceptional 96.5% |
| Syrians | 96.6 /100 | #116 | Exceptional 96.5% |
| Immigrants | Moldova | 95.7 /100 | #117 | Exceptional 96.5% |
| Immigrants | Japan | 95.5 /100 | #118 | Exceptional 96.5% |
| Immigrants | Norway | 95.2 /100 | #119 | Exceptional 96.5% |
| Immigrants | Croatia | 95.0 /100 | #120 | Exceptional 96.5% |
| Cheyenne | 94.9 /100 | #121 | Exceptional 96.5% |
| Immigrants | Europe | 94.8 /100 | #122 | Exceptional 96.5% |
| Immigrants | France | 94.7 /100 | #123 | Exceptional 96.5% |