Cajun vs Immigrants from Cambodia 7th Grade
COMPARE
Cajun
Immigrants from Cambodia
7th Grade
7th Grade Comparison
Cajuns
Immigrants from Cambodia
96.8%
7TH GRADE
99.5/ 100
METRIC RATING
72nd/ 347
METRIC RANK
93.7%
7TH GRADE
0.0/ 100
METRIC RATING
319th/ 347
METRIC RANK
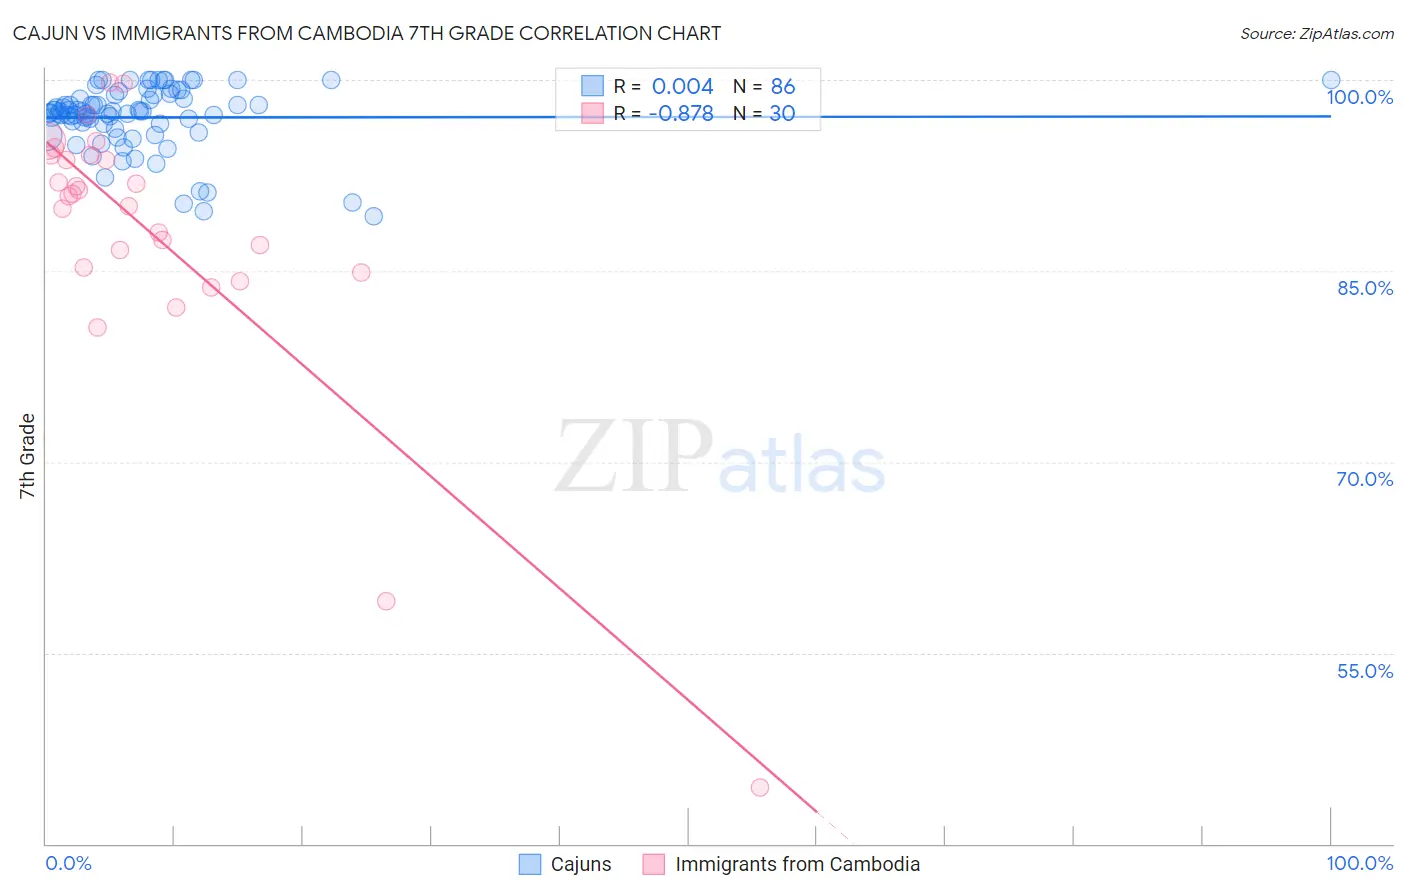
Cajun vs Immigrants from Cambodia 7th Grade Correlation Chart
The statistical analysis conducted on geographies consisting of 149,712,957 people shows no correlation between the proportion of Cajuns and percentage of population with at least 7th grade education in the United States with a correlation coefficient (R) of 0.004 and weighted average of 96.8%. Similarly, the statistical analysis conducted on geographies consisting of 205,153,442 people shows a very strong negative correlation between the proportion of Immigrants from Cambodia and percentage of population with at least 7th grade education in the United States with a correlation coefficient (R) of -0.878 and weighted average of 93.7%, a difference of 3.3%.
7th Grade Correlation Summary
| Measurement | Cajun | Immigrants from Cambodia |
| Minimum | 89.3% | 44.4% |
| Maximum | 100.0% | 99.8% |
| Range | 10.7% | 55.4% |
| Mean | 97.1% | 88.0% |
| Median | 97.5% | 90.9% |
| Interquartile 25% (IQ1) | 96.5% | 85.3% |
| Interquartile 75% (IQ3) | 98.8% | 94.1% |
| Interquartile Range (IQR) | 2.2% | 8.8% |
| Standard Deviation (Sample) | 2.5% | 11.2% |
| Standard Deviation (Population) | 2.5% | 11.0% |
Similar Demographics by 7th Grade
Demographics Similar to Cajuns by 7th Grade
In terms of 7th grade, the demographic groups most similar to Cajuns are New Zealander (96.8%, a difference of 0.010%), Immigrants from Lithuania (96.8%, a difference of 0.010%), Arapaho (96.8%, a difference of 0.010%), Iranian (96.8%, a difference of 0.020%), and Immigrants from England (96.8%, a difference of 0.030%).
| Demographics | Rating | Rank | 7th Grade |
| Canadians | 99.7 /100 | #65 | Exceptional 96.9% |
| Ukrainians | 99.7 /100 | #66 | Exceptional 96.9% |
| Native Hawaiians | 99.7 /100 | #67 | Exceptional 96.9% |
| Immigrants | India | 99.6 /100 | #68 | Exceptional 96.9% |
| Iranians | 99.6 /100 | #69 | Exceptional 96.8% |
| New Zealanders | 99.6 /100 | #70 | Exceptional 96.8% |
| Immigrants | Lithuania | 99.6 /100 | #71 | Exceptional 96.8% |
| Cajuns | 99.5 /100 | #72 | Exceptional 96.8% |
| Arapaho | 99.5 /100 | #73 | Exceptional 96.8% |
| Immigrants | England | 99.5 /100 | #74 | Exceptional 96.8% |
| Zimbabweans | 99.5 /100 | #75 | Exceptional 96.8% |
| Immigrants | Ireland | 99.4 /100 | #76 | Exceptional 96.8% |
| Cherokee | 99.4 /100 | #77 | Exceptional 96.8% |
| Immigrants | Netherlands | 99.3 /100 | #78 | Exceptional 96.8% |
| Cypriots | 99.3 /100 | #79 | Exceptional 96.8% |
Demographics Similar to Immigrants from Cambodia by 7th Grade
In terms of 7th grade, the demographic groups most similar to Immigrants from Cambodia are Immigrants from Ecuador (93.7%, a difference of 0.030%), Immigrants from Cuba (93.8%, a difference of 0.11%), Immigrants from Fiji (93.5%, a difference of 0.17%), Immigrants from Vietnam (93.9%, a difference of 0.20%), and Belizean (93.5%, a difference of 0.21%).
| Demographics | Rating | Rank | 7th Grade |
| Immigrants | Immigrants | 0.0 /100 | #312 | Tragic 94.0% |
| Immigrants | Bangladesh | 0.0 /100 | #313 | Tragic 94.0% |
| Japanese | 0.0 /100 | #314 | Tragic 94.0% |
| Vietnamese | 0.0 /100 | #315 | Tragic 93.9% |
| Immigrants | Vietnam | 0.0 /100 | #316 | Tragic 93.9% |
| Immigrants | Cuba | 0.0 /100 | #317 | Tragic 93.8% |
| Immigrants | Ecuador | 0.0 /100 | #318 | Tragic 93.7% |
| Immigrants | Cambodia | 0.0 /100 | #319 | Tragic 93.7% |
| Immigrants | Fiji | 0.0 /100 | #320 | Tragic 93.5% |
| Belizeans | 0.0 /100 | #321 | Tragic 93.5% |
| Nicaraguans | 0.0 /100 | #322 | Tragic 93.5% |
| Immigrants | Belize | 0.0 /100 | #323 | Tragic 93.4% |
| Dominicans | 0.0 /100 | #324 | Tragic 93.3% |
| Central American Indians | 0.0 /100 | #325 | Tragic 93.3% |
| Nepalese | 0.0 /100 | #326 | Tragic 93.2% |