Cypriot vs Immigrants from Nicaragua 8th Grade
COMPARE
Cypriot
Immigrants from Nicaragua
8th Grade
8th Grade Comparison
Cypriots
Immigrants from Nicaragua
96.5%
8TH GRADE
99.4/ 100
METRIC RATING
77th/ 347
METRIC RANK
92.5%
8TH GRADE
0.0/ 100
METRIC RATING
328th/ 347
METRIC RANK
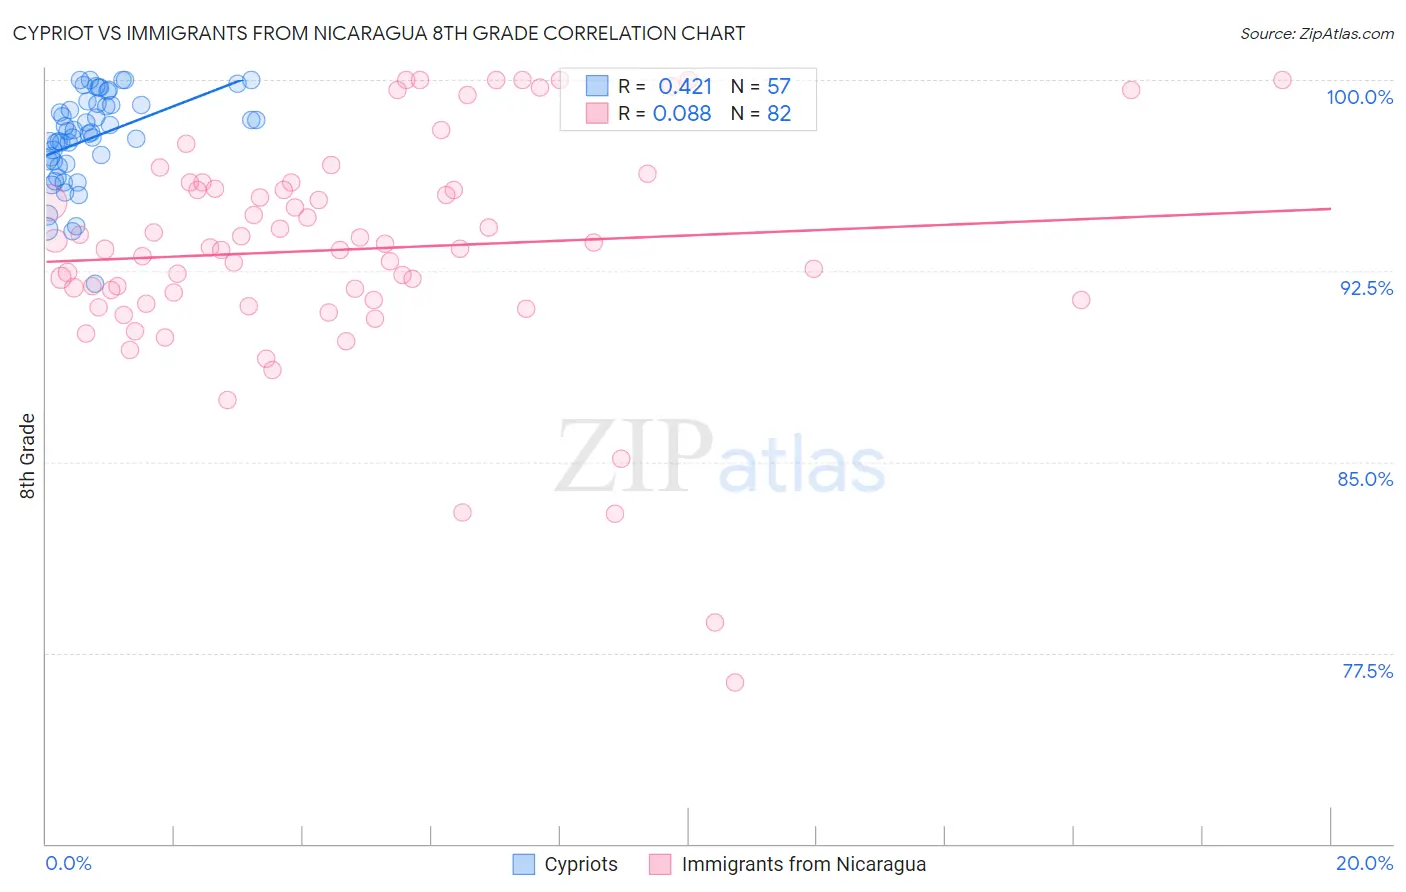
Cypriot vs Immigrants from Nicaragua 8th Grade Correlation Chart
The statistical analysis conducted on geographies consisting of 61,870,289 people shows a moderate positive correlation between the proportion of Cypriots and percentage of population with at least 8th grade education in the United States with a correlation coefficient (R) of 0.421 and weighted average of 96.5%. Similarly, the statistical analysis conducted on geographies consisting of 236,340,506 people shows a slight positive correlation between the proportion of Immigrants from Nicaragua and percentage of population with at least 8th grade education in the United States with a correlation coefficient (R) of 0.088 and weighted average of 92.5%, a difference of 4.4%.
8th Grade Correlation Summary
| Measurement | Cypriot | Immigrants from Nicaragua |
| Minimum | 92.0% | 76.3% |
| Maximum | 100.0% | 100.0% |
| Range | 8.0% | 23.7% |
| Mean | 97.7% | 93.4% |
| Median | 97.9% | 93.4% |
| Interquartile 25% (IQ1) | 96.8% | 91.4% |
| Interquartile 75% (IQ3) | 99.0% | 95.7% |
| Interquartile Range (IQR) | 2.3% | 4.3% |
| Standard Deviation (Sample) | 1.8% | 4.5% |
| Standard Deviation (Population) | 1.8% | 4.5% |
Similar Demographics by 8th Grade
Demographics Similar to Cypriots by 8th Grade
In terms of 8th grade, the demographic groups most similar to Cypriots are Immigrants from Netherlands (96.5%, a difference of 0.0%), Yugoslavian (96.5%, a difference of 0.0%), Immigrants from Ireland (96.5%, a difference of 0.010%), Zimbabwean (96.5%, a difference of 0.010%), and Immigrants from England (96.6%, a difference of 0.020%).
| Demographics | Rating | Rank | 8th Grade |
| Immigrants | Lithuania | 99.6 /100 | #70 | Exceptional 96.6% |
| New Zealanders | 99.5 /100 | #71 | Exceptional 96.6% |
| Immigrants | England | 99.5 /100 | #72 | Exceptional 96.6% |
| Arapaho | 99.5 /100 | #73 | Exceptional 96.6% |
| Immigrants | Ireland | 99.5 /100 | #74 | Exceptional 96.5% |
| Zimbabweans | 99.4 /100 | #75 | Exceptional 96.5% |
| Immigrants | Netherlands | 99.4 /100 | #76 | Exceptional 96.5% |
| Cypriots | 99.4 /100 | #77 | Exceptional 96.5% |
| Yugoslavians | 99.4 /100 | #78 | Exceptional 96.5% |
| Puget Sound Salish | 99.3 /100 | #79 | Exceptional 96.5% |
| Delaware | 99.2 /100 | #80 | Exceptional 96.5% |
| Romanians | 99.2 /100 | #81 | Exceptional 96.5% |
| Turks | 99.2 /100 | #82 | Exceptional 96.5% |
| Icelanders | 99.2 /100 | #83 | Exceptional 96.5% |
| Immigrants | Belgium | 99.1 /100 | #84 | Exceptional 96.5% |
Demographics Similar to Immigrants from Nicaragua by 8th Grade
In terms of 8th grade, the demographic groups most similar to Immigrants from Nicaragua are Immigrants from the Azores (92.5%, a difference of 0.030%), Immigrants from Cabo Verde (92.4%, a difference of 0.060%), Immigrants from Armenia (92.3%, a difference of 0.15%), Honduran (92.3%, a difference of 0.15%), and Immigrants from Dominican Republic (92.3%, a difference of 0.17%).
| Demographics | Rating | Rank | 8th Grade |
| Belizeans | 0.0 /100 | #321 | Tragic 93.1% |
| Nicaraguans | 0.0 /100 | #322 | Tragic 93.0% |
| Immigrants | Belize | 0.0 /100 | #323 | Tragic 92.9% |
| Nepalese | 0.0 /100 | #324 | Tragic 92.8% |
| Dominicans | 0.0 /100 | #325 | Tragic 92.8% |
| Central American Indians | 0.0 /100 | #326 | Tragic 92.7% |
| Immigrants | Azores | 0.0 /100 | #327 | Tragic 92.5% |
| Immigrants | Nicaragua | 0.0 /100 | #328 | Tragic 92.5% |
| Immigrants | Cabo Verde | 0.0 /100 | #329 | Tragic 92.4% |
| Immigrants | Armenia | 0.0 /100 | #330 | Tragic 92.3% |
| Hondurans | 0.0 /100 | #331 | Tragic 92.3% |
| Immigrants | Dominican Republic | 0.0 /100 | #332 | Tragic 92.3% |
| Hispanics or Latinos | 0.0 /100 | #333 | Tragic 92.2% |
| Immigrants | Yemen | 0.0 /100 | #334 | Tragic 92.1% |
| Mexican American Indians | 0.0 /100 | #335 | Tragic 92.1% |