Immigrants from Eastern Africa vs Arab Kindergarten
COMPARE
Immigrants from Eastern Africa
Arab
Kindergarten
Kindergarten Comparison
Immigrants from Eastern Africa
Arabs
97.6%
KINDERGARTEN
1.0/ 100
METRIC RATING
247th/ 347
METRIC RANK
97.9%
KINDERGARTEN
35.4/ 100
METRIC RATING
188th/ 347
METRIC RANK
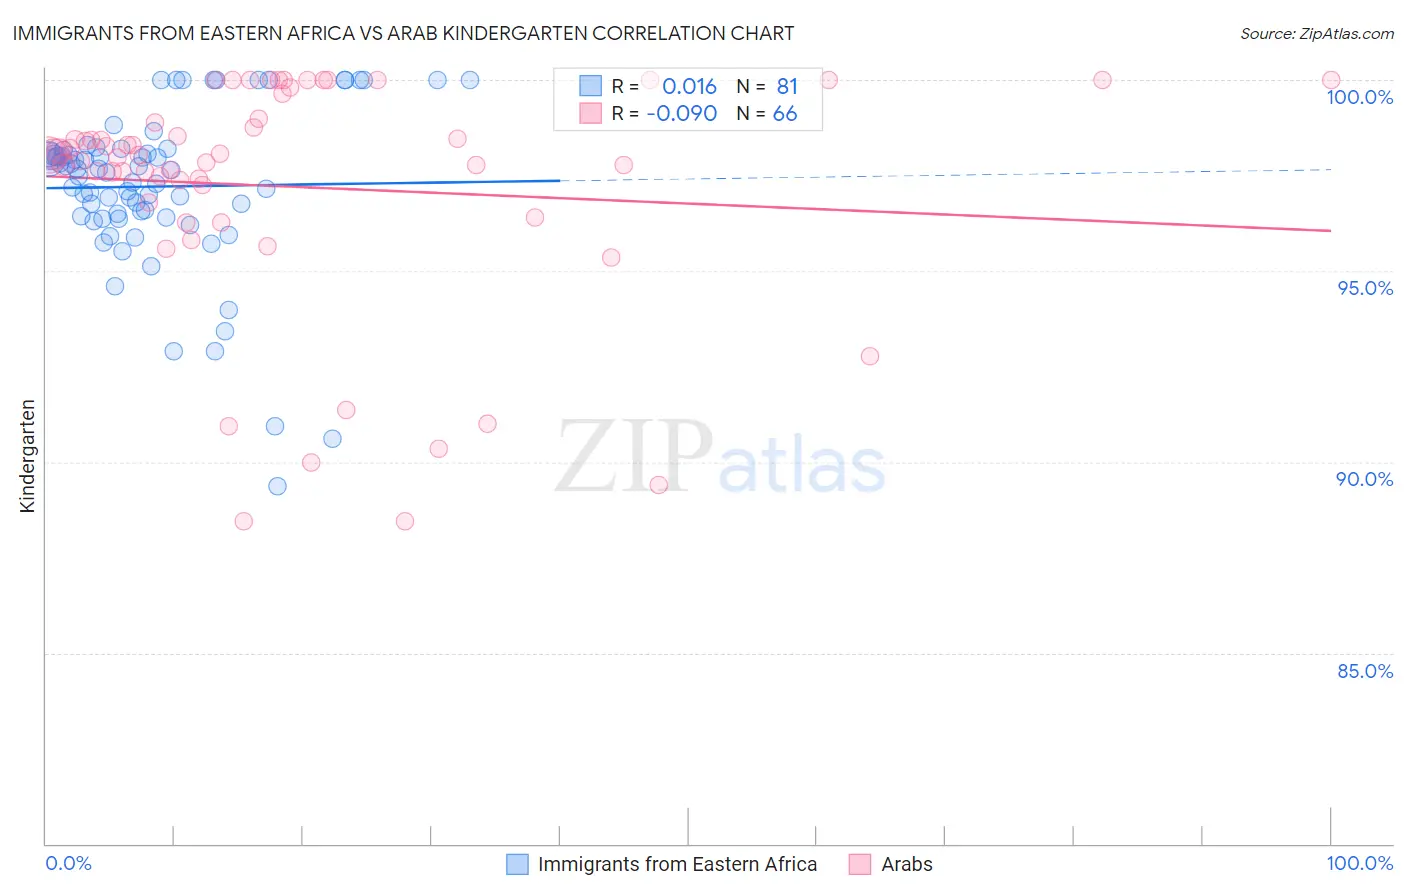
Immigrants from Eastern Africa vs Arab Kindergarten Correlation Chart
The statistical analysis conducted on geographies consisting of 355,144,184 people shows no correlation between the proportion of Immigrants from Eastern Africa and percentage of population with at least kindergarten education in the United States with a correlation coefficient (R) of 0.016 and weighted average of 97.6%. Similarly, the statistical analysis conducted on geographies consisting of 486,872,222 people shows a slight negative correlation between the proportion of Arabs and percentage of population with at least kindergarten education in the United States with a correlation coefficient (R) of -0.090 and weighted average of 97.9%, a difference of 0.31%.
Kindergarten Correlation Summary
| Measurement | Immigrants from Eastern Africa | Arab |
| Minimum | 89.4% | 88.4% |
| Maximum | 100.0% | 100.0% |
| Range | 10.6% | 11.6% |
| Mean | 97.2% | 97.2% |
| Median | 97.6% | 98.0% |
| Interquartile 25% (IQ1) | 96.4% | 96.8% |
| Interquartile 75% (IQ3) | 98.1% | 99.0% |
| Interquartile Range (IQR) | 1.7% | 2.2% |
| Standard Deviation (Sample) | 2.1% | 3.1% |
| Standard Deviation (Population) | 2.1% | 3.0% |
Similar Demographics by Kindergarten
Demographics Similar to Immigrants from Eastern Africa by Kindergarten
In terms of kindergarten, the demographic groups most similar to Immigrants from Eastern Africa are South American (97.6%, a difference of 0.0%), Indian (Asian) (97.6%, a difference of 0.0%), Immigrants from Middle Africa (97.6%, a difference of 0.0%), Peruvian (97.6%, a difference of 0.0%), and Asian (97.6%, a difference of 0.010%).
| Demographics | Rating | Rank | Kindergarten |
| Koreans | 1.6 /100 | #240 | Tragic 97.6% |
| Liberians | 1.3 /100 | #241 | Tragic 97.6% |
| Immigrants | Indonesia | 1.3 /100 | #242 | Tragic 97.6% |
| Asians | 1.2 /100 | #243 | Tragic 97.6% |
| Bolivians | 1.2 /100 | #244 | Tragic 97.6% |
| South Americans | 1.1 /100 | #245 | Tragic 97.6% |
| Indians (Asian) | 1.0 /100 | #246 | Tragic 97.6% |
| Immigrants | Eastern Africa | 1.0 /100 | #247 | Tragic 97.6% |
| Immigrants | Middle Africa | 1.0 /100 | #248 | Tragic 97.6% |
| Peruvians | 1.0 /100 | #249 | Tragic 97.6% |
| Immigrants | Senegal | 0.9 /100 | #250 | Tragic 97.6% |
| Ethiopians | 0.9 /100 | #251 | Tragic 97.6% |
| Immigrants | Iraq | 0.9 /100 | #252 | Tragic 97.6% |
| Immigrants | Africa | 0.8 /100 | #253 | Tragic 97.6% |
| Immigrants | Asia | 0.8 /100 | #254 | Tragic 97.6% |
Demographics Similar to Arabs by Kindergarten
In terms of kindergarten, the demographic groups most similar to Arabs are Pakistani (97.9%, a difference of 0.0%), Immigrants from Kazakhstan (97.9%, a difference of 0.0%), Paiute (97.9%, a difference of 0.0%), Immigrants from Belarus (97.9%, a difference of 0.010%), and Panamanian (97.9%, a difference of 0.010%).
| Demographics | Rating | Rank | Kindergarten |
| Portuguese | 43.5 /100 | #181 | Average 97.9% |
| Egyptians | 42.4 /100 | #182 | Average 97.9% |
| Immigrants | Poland | 41.4 /100 | #183 | Average 97.9% |
| Immigrants | Argentina | 40.7 /100 | #184 | Average 97.9% |
| Immigrants | Belarus | 39.4 /100 | #185 | Fair 97.9% |
| Pakistanis | 36.0 /100 | #186 | Fair 97.9% |
| Immigrants | Kazakhstan | 35.9 /100 | #187 | Fair 97.9% |
| Arabs | 35.4 /100 | #188 | Fair 97.9% |
| Paiute | 34.7 /100 | #189 | Fair 97.9% |
| Panamanians | 33.3 /100 | #190 | Fair 97.9% |
| Immigrants | Taiwan | 30.7 /100 | #191 | Fair 97.9% |
| Blacks/African Americans | 29.9 /100 | #192 | Fair 97.9% |
| Paraguayans | 29.6 /100 | #193 | Fair 97.9% |
| Hawaiians | 29.3 /100 | #194 | Fair 97.9% |
| Mongolians | 28.9 /100 | #195 | Fair 97.9% |