Cajun vs Immigrants from Uruguay 2nd Grade
COMPARE
Cajun
Immigrants from Uruguay
2nd Grade
2nd Grade Comparison
Cajuns
Immigrants from Uruguay
98.3%
2ND GRADE
99.5/ 100
METRIC RATING
73rd/ 347
METRIC RANK
97.6%
2ND GRADE
2.1/ 100
METRIC RATING
233rd/ 347
METRIC RANK
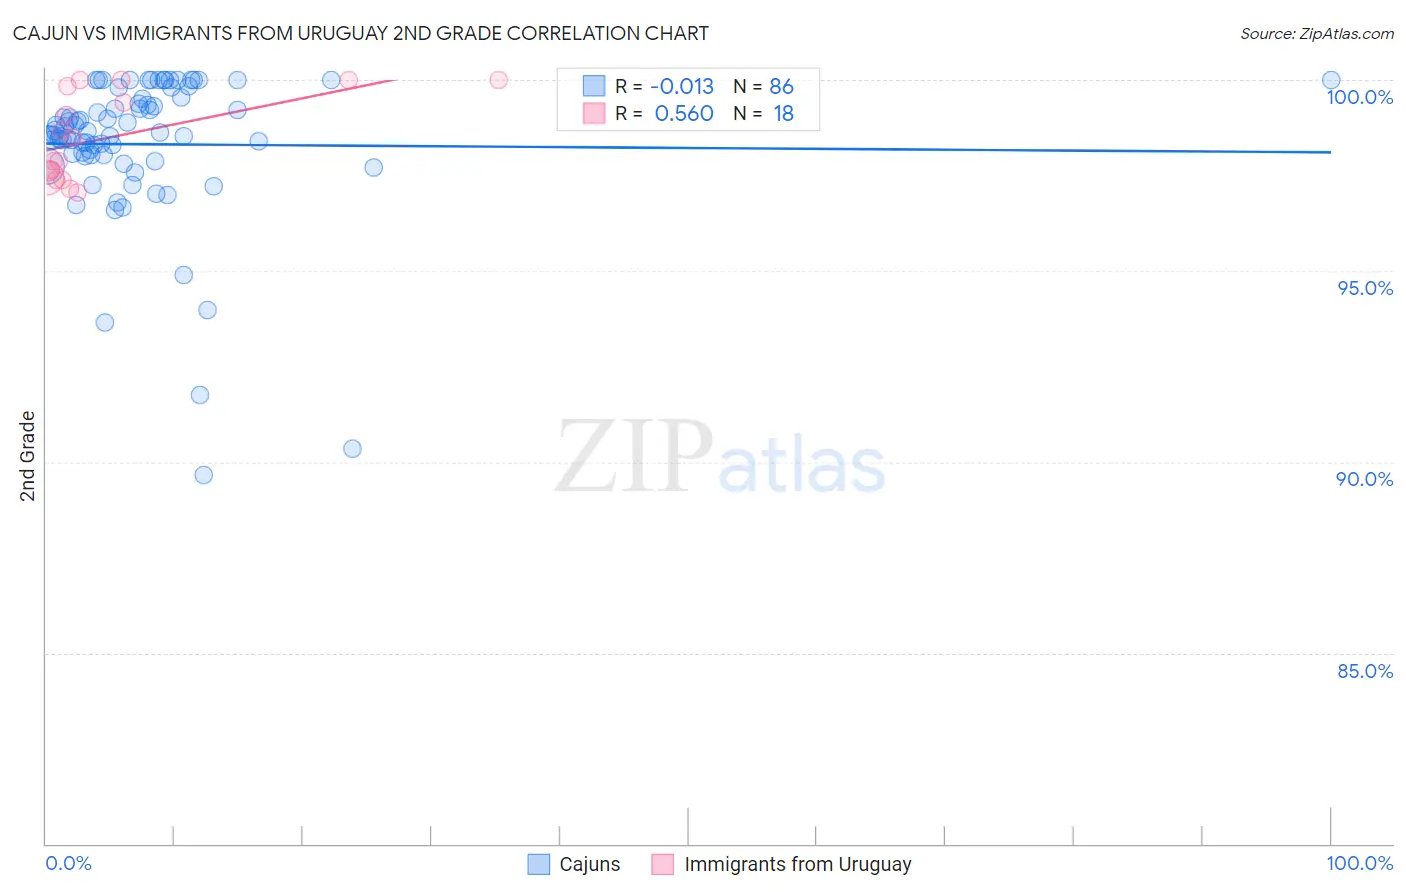
Cajun vs Immigrants from Uruguay 2nd Grade Correlation Chart
The statistical analysis conducted on geographies consisting of 149,712,957 people shows no correlation between the proportion of Cajuns and percentage of population with at least 2nd grade education in the United States with a correlation coefficient (R) of -0.013 and weighted average of 98.3%. Similarly, the statistical analysis conducted on geographies consisting of 133,259,667 people shows a substantial positive correlation between the proportion of Immigrants from Uruguay and percentage of population with at least 2nd grade education in the United States with a correlation coefficient (R) of 0.560 and weighted average of 97.6%, a difference of 0.73%.
2nd Grade Correlation Summary
| Measurement | Cajun | Immigrants from Uruguay |
| Minimum | 89.7% | 97.1% |
| Maximum | 100.0% | 100.0% |
| Range | 10.3% | 2.9% |
| Mean | 98.3% | 98.5% |
| Median | 98.6% | 98.2% |
| Interquartile 25% (IQ1) | 98.0% | 97.4% |
| Interquartile 75% (IQ3) | 99.5% | 99.8% |
| Interquartile Range (IQR) | 1.5% | 2.4% |
| Standard Deviation (Sample) | 1.9% | 1.1% |
| Standard Deviation (Population) | 1.9% | 1.1% |
Similar Demographics by 2nd Grade
Demographics Similar to Cajuns by 2nd Grade
In terms of 2nd grade, the demographic groups most similar to Cajuns are Cheyenne (98.3%, a difference of 0.0%), Chickasaw (98.3%, a difference of 0.010%), Canadian (98.3%, a difference of 0.020%), Immigrants from Northern Europe (98.3%, a difference of 0.020%), and Russian (98.3%, a difference of 0.020%).
| Demographics | Rating | Rank | 2nd Grade |
| Canadians | 99.7 /100 | #66 | Exceptional 98.3% |
| Immigrants | Northern Europe | 99.7 /100 | #67 | Exceptional 98.3% |
| Russians | 99.7 /100 | #68 | Exceptional 98.3% |
| Immigrants | Austria | 99.6 /100 | #69 | Exceptional 98.3% |
| Serbians | 99.6 /100 | #70 | Exceptional 98.3% |
| Chickasaw | 99.6 /100 | #71 | Exceptional 98.3% |
| Cheyenne | 99.6 /100 | #72 | Exceptional 98.3% |
| Cajuns | 99.5 /100 | #73 | Exceptional 98.3% |
| Immigrants | Netherlands | 99.4 /100 | #74 | Exceptional 98.3% |
| Shoshone | 99.4 /100 | #75 | Exceptional 98.3% |
| Cherokee | 99.4 /100 | #76 | Exceptional 98.3% |
| Immigrants | England | 99.4 /100 | #77 | Exceptional 98.3% |
| Immigrants | Lithuania | 99.3 /100 | #78 | Exceptional 98.2% |
| Immigrants | Belgium | 99.3 /100 | #79 | Exceptional 98.2% |
| Osage | 99.2 /100 | #80 | Exceptional 98.2% |
Demographics Similar to Immigrants from Uruguay by 2nd Grade
In terms of 2nd grade, the demographic groups most similar to Immigrants from Uruguay are Immigrants from Western Asia (97.6%, a difference of 0.0%), Immigrants from Malaysia (97.6%, a difference of 0.0%), Immigrants from Pakistan (97.6%, a difference of 0.010%), Colombian (97.6%, a difference of 0.010%), and Nigerian (97.6%, a difference of 0.020%).
| Demographics | Rating | Rank | 2nd Grade |
| Immigrants | Syria | 4.0 /100 | #226 | Tragic 97.6% |
| Immigrants | Nepal | 4.0 /100 | #227 | Tragic 97.6% |
| Sub-Saharan Africans | 3.4 /100 | #228 | Tragic 97.6% |
| Immigrants | Costa Rica | 3.1 /100 | #229 | Tragic 97.6% |
| Senegalese | 3.1 /100 | #230 | Tragic 97.6% |
| Immigrants | Pakistan | 2.3 /100 | #231 | Tragic 97.6% |
| Immigrants | Western Asia | 2.1 /100 | #232 | Tragic 97.6% |
| Immigrants | Uruguay | 2.1 /100 | #233 | Tragic 97.6% |
| Immigrants | Malaysia | 2.0 /100 | #234 | Tragic 97.6% |
| Colombians | 1.9 /100 | #235 | Tragic 97.6% |
| Nigerians | 1.7 /100 | #236 | Tragic 97.6% |
| U.S. Virgin Islanders | 1.6 /100 | #237 | Tragic 97.6% |
| Immigrants | Eastern Asia | 1.6 /100 | #238 | Tragic 97.6% |
| Liberians | 1.6 /100 | #239 | Tragic 97.6% |
| Koreans | 1.5 /100 | #240 | Tragic 97.5% |