Burmese vs Latvian 2nd Grade
COMPARE
Burmese
Latvian
2nd Grade
2nd Grade Comparison
Burmese
Latvians
98.0%
2ND GRADE
81.0/ 100
METRIC RATING
142nd/ 347
METRIC RANK
98.4%
2ND GRADE
99.9/ 100
METRIC RATING
38th/ 347
METRIC RANK
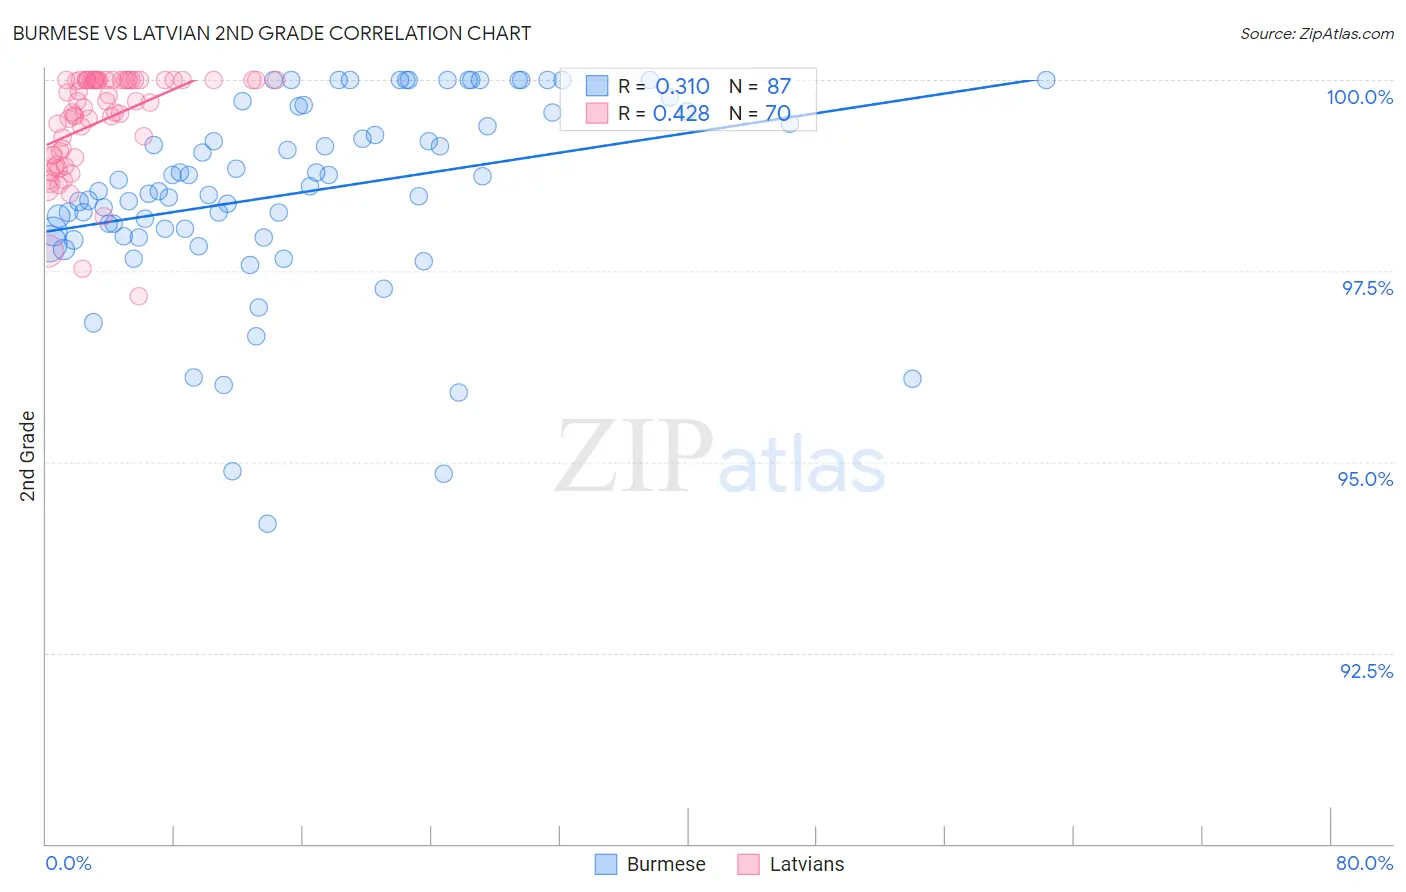
Burmese vs Latvian 2nd Grade Correlation Chart
The statistical analysis conducted on geographies consisting of 465,408,311 people shows a mild positive correlation between the proportion of Burmese and percentage of population with at least 2nd grade education in the United States with a correlation coefficient (R) of 0.310 and weighted average of 98.0%. Similarly, the statistical analysis conducted on geographies consisting of 220,726,452 people shows a moderate positive correlation between the proportion of Latvians and percentage of population with at least 2nd grade education in the United States with a correlation coefficient (R) of 0.428 and weighted average of 98.4%, a difference of 0.47%.
2nd Grade Correlation Summary
| Measurement | Burmese | Latvian |
| Minimum | 94.2% | 97.2% |
| Maximum | 100.0% | 100.0% |
| Range | 5.8% | 2.8% |
| Mean | 98.5% | 99.5% |
| Median | 98.5% | 99.7% |
| Interquartile 25% (IQ1) | 98.0% | 99.0% |
| Interquartile 75% (IQ3) | 99.6% | 100.0% |
| Interquartile Range (IQR) | 1.6% | 0.99% |
| Standard Deviation (Sample) | 1.3% | 0.66% |
| Standard Deviation (Population) | 1.3% | 0.66% |
Similar Demographics by 2nd Grade
Demographics Similar to Burmese by 2nd Grade
In terms of 2nd grade, the demographic groups most similar to Burmese are Alsatian (98.0%, a difference of 0.0%), Immigrants from Turkey (98.0%, a difference of 0.010%), Hmong (98.0%, a difference of 0.010%), Filipino (98.0%, a difference of 0.010%), and Immigrants from Israel (98.0%, a difference of 0.010%).
| Demographics | Rating | Rank | 2nd Grade |
| Immigrants | Bulgaria | 89.7 /100 | #135 | Excellent 98.0% |
| Immigrants | Kuwait | 89.2 /100 | #136 | Excellent 98.0% |
| Immigrants | Romania | 88.3 /100 | #137 | Excellent 98.0% |
| Israelis | 87.9 /100 | #138 | Excellent 98.0% |
| Blackfeet | 87.5 /100 | #139 | Excellent 98.0% |
| Palestinians | 83.9 /100 | #140 | Excellent 98.0% |
| Immigrants | Turkey | 83.0 /100 | #141 | Excellent 98.0% |
| Burmese | 81.0 /100 | #142 | Excellent 98.0% |
| Alsatians | 80.5 /100 | #143 | Excellent 98.0% |
| Hmong | 80.0 /100 | #144 | Good 98.0% |
| Filipinos | 79.2 /100 | #145 | Good 98.0% |
| Immigrants | Israel | 78.0 /100 | #146 | Good 98.0% |
| Immigrants | Greece | 76.8 /100 | #147 | Good 98.0% |
| Jordanians | 74.5 /100 | #148 | Good 98.0% |
| Apache | 74.0 /100 | #149 | Good 97.9% |
Demographics Similar to Latvians by 2nd Grade
In terms of 2nd grade, the demographic groups most similar to Latvians are Chippewa (98.4%, a difference of 0.0%), Italian (98.4%, a difference of 0.010%), Luxembourger (98.4%, a difference of 0.010%), Eastern European (98.4%, a difference of 0.010%), and Native Hawaiian (98.4%, a difference of 0.020%).
| Demographics | Rating | Rank | 2nd Grade |
| Czechs | 100.0 /100 | #31 | Exceptional 98.5% |
| French Canadians | 100.0 /100 | #32 | Exceptional 98.5% |
| Scandinavians | 100.0 /100 | #33 | Exceptional 98.5% |
| Chinese | 100.0 /100 | #34 | Exceptional 98.5% |
| Swiss | 100.0 /100 | #35 | Exceptional 98.5% |
| British | 100.0 /100 | #36 | Exceptional 98.5% |
| Italians | 99.9 /100 | #37 | Exceptional 98.4% |
| Latvians | 99.9 /100 | #38 | Exceptional 98.4% |
| Chippewa | 99.9 /100 | #39 | Exceptional 98.4% |
| Luxembourgers | 99.9 /100 | #40 | Exceptional 98.4% |
| Eastern Europeans | 99.9 /100 | #41 | Exceptional 98.4% |
| Native Hawaiians | 99.9 /100 | #42 | Exceptional 98.4% |
| Belgians | 99.9 /100 | #43 | Exceptional 98.4% |
| Northern Europeans | 99.9 /100 | #44 | Exceptional 98.4% |
| Hungarians | 99.9 /100 | #45 | Exceptional 98.4% |