Burmese vs Immigrants from Western Europe 12th Grade, No Diploma
COMPARE
Burmese
Immigrants from Western Europe
12th Grade, No Diploma
12th Grade, No Diploma Comparison
Burmese
Immigrants from Western Europe
92.6%
12TH GRADE, NO DIPLOMA
99.4/ 100
METRIC RATING
73rd/ 347
METRIC RANK
92.3%
12TH GRADE, NO DIPLOMA
98.5/ 100
METRIC RATING
93rd/ 347
METRIC RANK
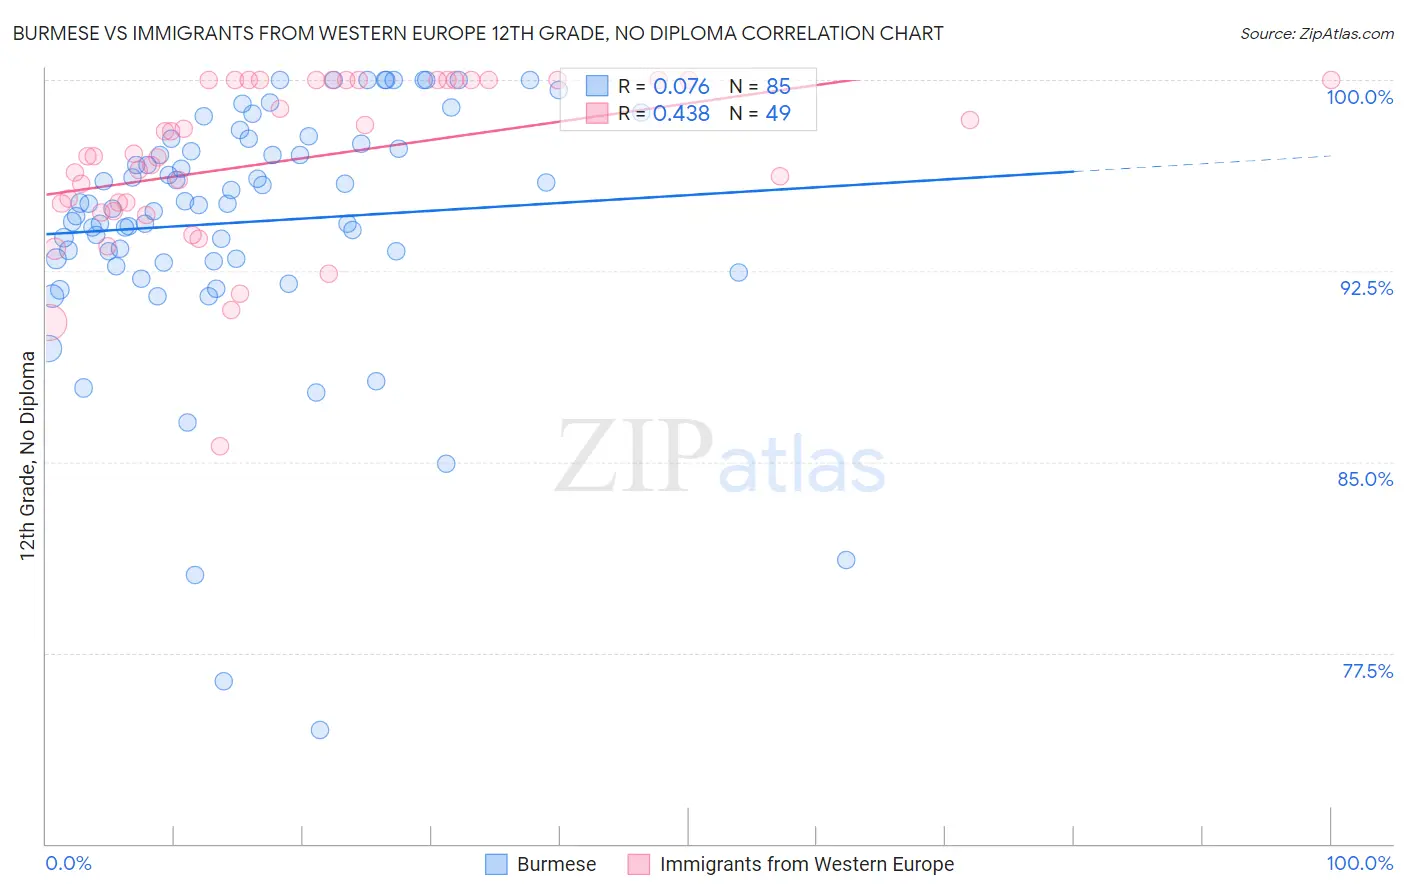
Burmese vs Immigrants from Western Europe 12th Grade, No Diploma Correlation Chart
The statistical analysis conducted on geographies consisting of 465,370,486 people shows a slight positive correlation between the proportion of Burmese and percentage of population with at least 12th grade (no diploma) education in the United States with a correlation coefficient (R) of 0.076 and weighted average of 92.6%. Similarly, the statistical analysis conducted on geographies consisting of 494,079,664 people shows a moderate positive correlation between the proportion of Immigrants from Western Europe and percentage of population with at least 12th grade (no diploma) education in the United States with a correlation coefficient (R) of 0.438 and weighted average of 92.3%, a difference of 0.29%.
12th Grade, No Diploma Correlation Summary
| Measurement | Burmese | Immigrants from Western Europe |
| Minimum | 74.5% | 85.6% |
| Maximum | 100.0% | 100.0% |
| Range | 25.5% | 14.4% |
| Mean | 94.4% | 96.9% |
| Median | 95.1% | 97.0% |
| Interquartile 25% (IQ1) | 92.9% | 95.0% |
| Interquartile 75% (IQ3) | 97.6% | 100.0% |
| Interquartile Range (IQR) | 4.7% | 5.0% |
| Standard Deviation (Sample) | 4.9% | 3.2% |
| Standard Deviation (Population) | 4.9% | 3.2% |
Demographics Similar to Burmese and Immigrants from Western Europe by 12th Grade, No Diploma
In terms of 12th grade, no diploma, the demographic groups most similar to Burmese are Immigrants from Moldova (92.6%, a difference of 0.0%), Native Hawaiian (92.6%, a difference of 0.0%), French (92.6%, a difference of 0.010%), Immigrants from England (92.6%, a difference of 0.020%), and Cambodian (92.6%, a difference of 0.050%). Similarly, the demographic groups most similar to Immigrants from Western Europe are Immigrants from Romania (92.3%, a difference of 0.0%), South African (92.4%, a difference of 0.010%), Immigrants from Serbia (92.4%, a difference of 0.020%), Canadian (92.4%, a difference of 0.030%), and Scotch-Irish (92.4%, a difference of 0.050%).
| Demographics | Rating | Rank | 12th Grade, No Diploma |
| Burmese | 99.4 /100 | #73 | Exceptional 92.6% |
| Immigrants | Moldova | 99.4 /100 | #74 | Exceptional 92.6% |
| Native Hawaiians | 99.4 /100 | #75 | Exceptional 92.6% |
| French | 99.4 /100 | #76 | Exceptional 92.6% |
| Immigrants | England | 99.4 /100 | #77 | Exceptional 92.6% |
| Cambodians | 99.3 /100 | #78 | Exceptional 92.6% |
| Romanians | 99.3 /100 | #79 | Exceptional 92.6% |
| French Canadians | 99.3 /100 | #80 | Exceptional 92.6% |
| Immigrants | Denmark | 99.2 /100 | #81 | Exceptional 92.5% |
| Immigrants | Switzerland | 99.2 /100 | #82 | Exceptional 92.5% |
| Immigrants | Israel | 99.2 /100 | #83 | Exceptional 92.5% |
| Immigrants | Bulgaria | 99.1 /100 | #84 | Exceptional 92.5% |
| Immigrants | Saudi Arabia | 99.0 /100 | #85 | Exceptional 92.5% |
| Immigrants | Turkey | 98.9 /100 | #86 | Exceptional 92.4% |
| Immigrants | France | 98.8 /100 | #87 | Exceptional 92.4% |
| Scotch-Irish | 98.8 /100 | #88 | Exceptional 92.4% |
| Canadians | 98.7 /100 | #89 | Exceptional 92.4% |
| Immigrants | Serbia | 98.6 /100 | #90 | Exceptional 92.4% |
| South Africans | 98.6 /100 | #91 | Exceptional 92.4% |
| Immigrants | Romania | 98.5 /100 | #92 | Exceptional 92.3% |
| Immigrants | Western Europe | 98.5 /100 | #93 | Exceptional 92.3% |