British West Indian vs Immigrants from Oceania Kindergarten
COMPARE
British West Indian
Immigrants from Oceania
Kindergarten
Kindergarten Comparison
British West Indians
Immigrants from Oceania
97.3%
KINDERGARTEN
0.0/ 100
METRIC RATING
292nd/ 347
METRIC RANK
97.8%
KINDERGARTEN
11.1/ 100
METRIC RATING
210th/ 347
METRIC RANK
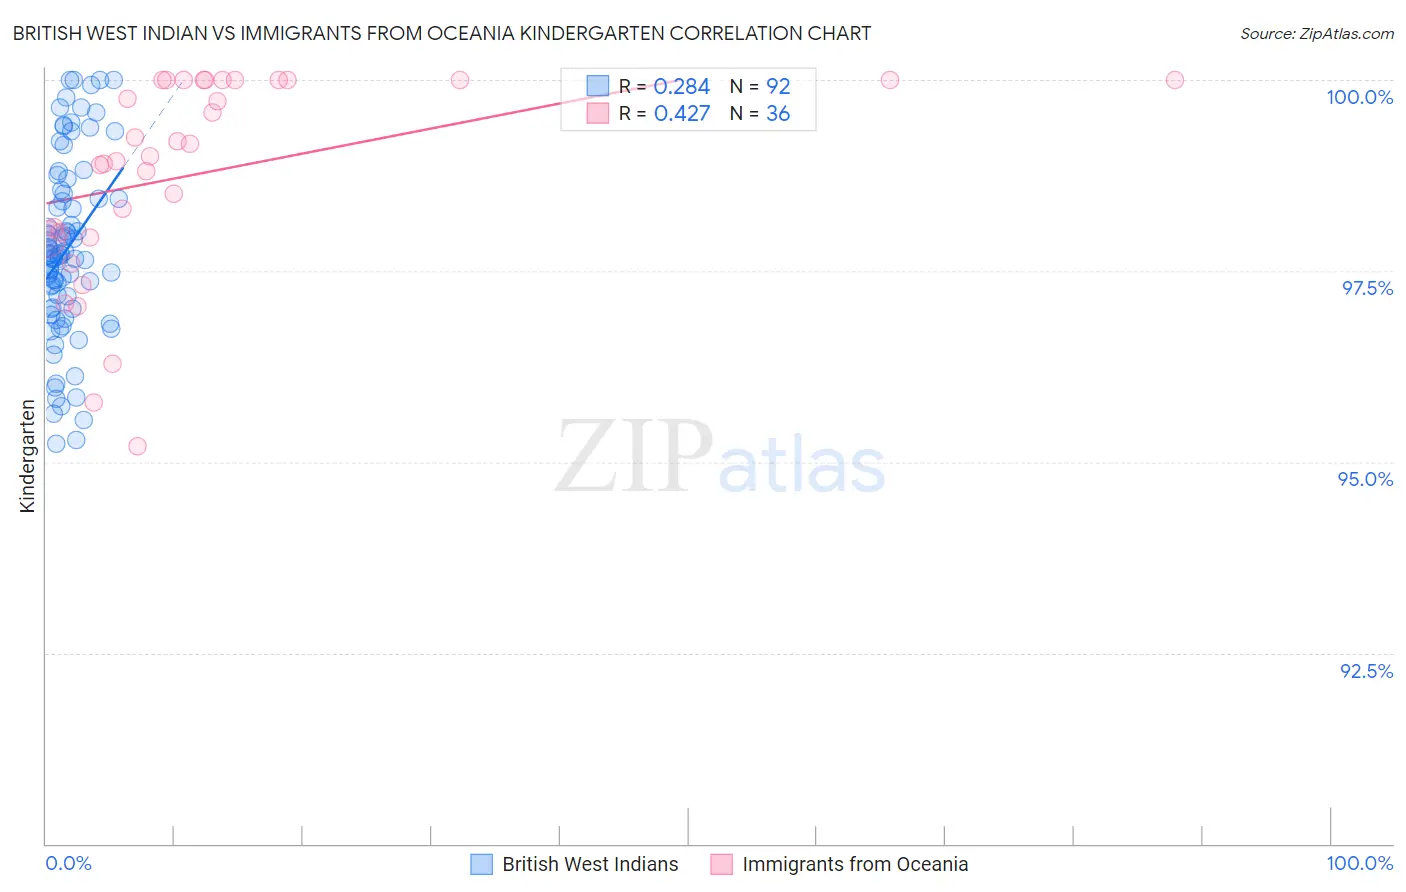
British West Indian vs Immigrants from Oceania Kindergarten Correlation Chart
The statistical analysis conducted on geographies consisting of 152,691,173 people shows a weak positive correlation between the proportion of British West Indians and percentage of population with at least kindergarten education in the United States with a correlation coefficient (R) of 0.284 and weighted average of 97.3%. Similarly, the statistical analysis conducted on geographies consisting of 305,516,300 people shows a moderate positive correlation between the proportion of Immigrants from Oceania and percentage of population with at least kindergarten education in the United States with a correlation coefficient (R) of 0.427 and weighted average of 97.8%, a difference of 0.56%.
Kindergarten Correlation Summary
| Measurement | British West Indian | Immigrants from Oceania |
| Minimum | 95.2% | 95.2% |
| Maximum | 100.0% | 100.0% |
| Range | 4.8% | 4.8% |
| Mean | 97.8% | 98.8% |
| Median | 97.7% | 99.1% |
| Interquartile 25% (IQ1) | 97.0% | 98.0% |
| Interquartile 75% (IQ3) | 98.5% | 100.0% |
| Interquartile Range (IQR) | 1.5% | 2.0% |
| Standard Deviation (Sample) | 1.2% | 1.3% |
| Standard Deviation (Population) | 1.2% | 1.3% |
Similar Demographics by Kindergarten
Demographics Similar to British West Indians by Kindergarten
In terms of kindergarten, the demographic groups most similar to British West Indians are Houma (97.3%, a difference of 0.010%), Malaysian (97.2%, a difference of 0.010%), Immigrants from St. Vincent and the Grenadines (97.3%, a difference of 0.030%), Immigrants from Afghanistan (97.3%, a difference of 0.040%), and Immigrants (97.2%, a difference of 0.040%).
| Demographics | Rating | Rank | Kindergarten |
| Immigrants | Portugal | 0.0 /100 | #285 | Tragic 97.3% |
| Immigrants | Barbados | 0.0 /100 | #286 | Tragic 97.3% |
| Immigrants | Hong Kong | 0.0 /100 | #287 | Tragic 97.3% |
| Immigrants | Thailand | 0.0 /100 | #288 | Tragic 97.3% |
| Immigrants | Afghanistan | 0.0 /100 | #289 | Tragic 97.3% |
| Immigrants | St. Vincent and the Grenadines | 0.0 /100 | #290 | Tragic 97.3% |
| Houma | 0.0 /100 | #291 | Tragic 97.3% |
| British West Indians | 0.0 /100 | #292 | Tragic 97.3% |
| Malaysians | 0.0 /100 | #293 | Tragic 97.2% |
| Immigrants | Immigrants | 0.0 /100 | #294 | Tragic 97.2% |
| Immigrants | Grenada | 0.0 /100 | #295 | Tragic 97.2% |
| Immigrants | Eritrea | 0.0 /100 | #296 | Tragic 97.2% |
| Central American Indians | 0.0 /100 | #297 | Tragic 97.2% |
| Immigrants | Dominica | 0.0 /100 | #298 | Tragic 97.1% |
| Immigrants | Cuba | 0.0 /100 | #299 | Tragic 97.1% |
Demographics Similar to Immigrants from Oceania by Kindergarten
In terms of kindergarten, the demographic groups most similar to Immigrants from Oceania are Costa Rican (97.8%, a difference of 0.0%), Laotian (97.8%, a difference of 0.0%), Immigrants from Northern Africa (97.8%, a difference of 0.010%), Moroccan (97.8%, a difference of 0.020%), and Immigrants from Albania (97.8%, a difference of 0.030%).
| Demographics | Rating | Rank | Kindergarten |
| Immigrants | Uganda | 18.8 /100 | #203 | Poor 97.8% |
| Immigrants | Chile | 18.1 /100 | #204 | Poor 97.8% |
| Immigrants | Southern Europe | 18.0 /100 | #205 | Poor 97.8% |
| Immigrants | Albania | 16.4 /100 | #206 | Poor 97.8% |
| Africans | 16.1 /100 | #207 | Poor 97.8% |
| Immigrants | Northern Africa | 12.0 /100 | #208 | Poor 97.8% |
| Costa Ricans | 11.6 /100 | #209 | Poor 97.8% |
| Immigrants | Oceania | 11.1 /100 | #210 | Poor 97.8% |
| Laotians | 10.5 /100 | #211 | Poor 97.8% |
| Moroccans | 8.9 /100 | #212 | Tragic 97.8% |
| South American Indians | 7.7 /100 | #213 | Tragic 97.8% |
| Uruguayans | 7.5 /100 | #214 | Tragic 97.8% |
| Immigrants | Bahamas | 7.4 /100 | #215 | Tragic 97.8% |
| Samoans | 6.9 /100 | #216 | Tragic 97.8% |
| Bahamians | 6.6 /100 | #217 | Tragic 97.8% |