Macedonian vs Immigrants from Oceania Kindergarten
COMPARE
Macedonian
Immigrants from Oceania
Kindergarten
Kindergarten Comparison
Macedonians
Immigrants from Oceania
98.3%
KINDERGARTEN
98.7/ 100
METRIC RATING
92nd/ 347
METRIC RANK
97.8%
KINDERGARTEN
11.1/ 100
METRIC RATING
210th/ 347
METRIC RANK
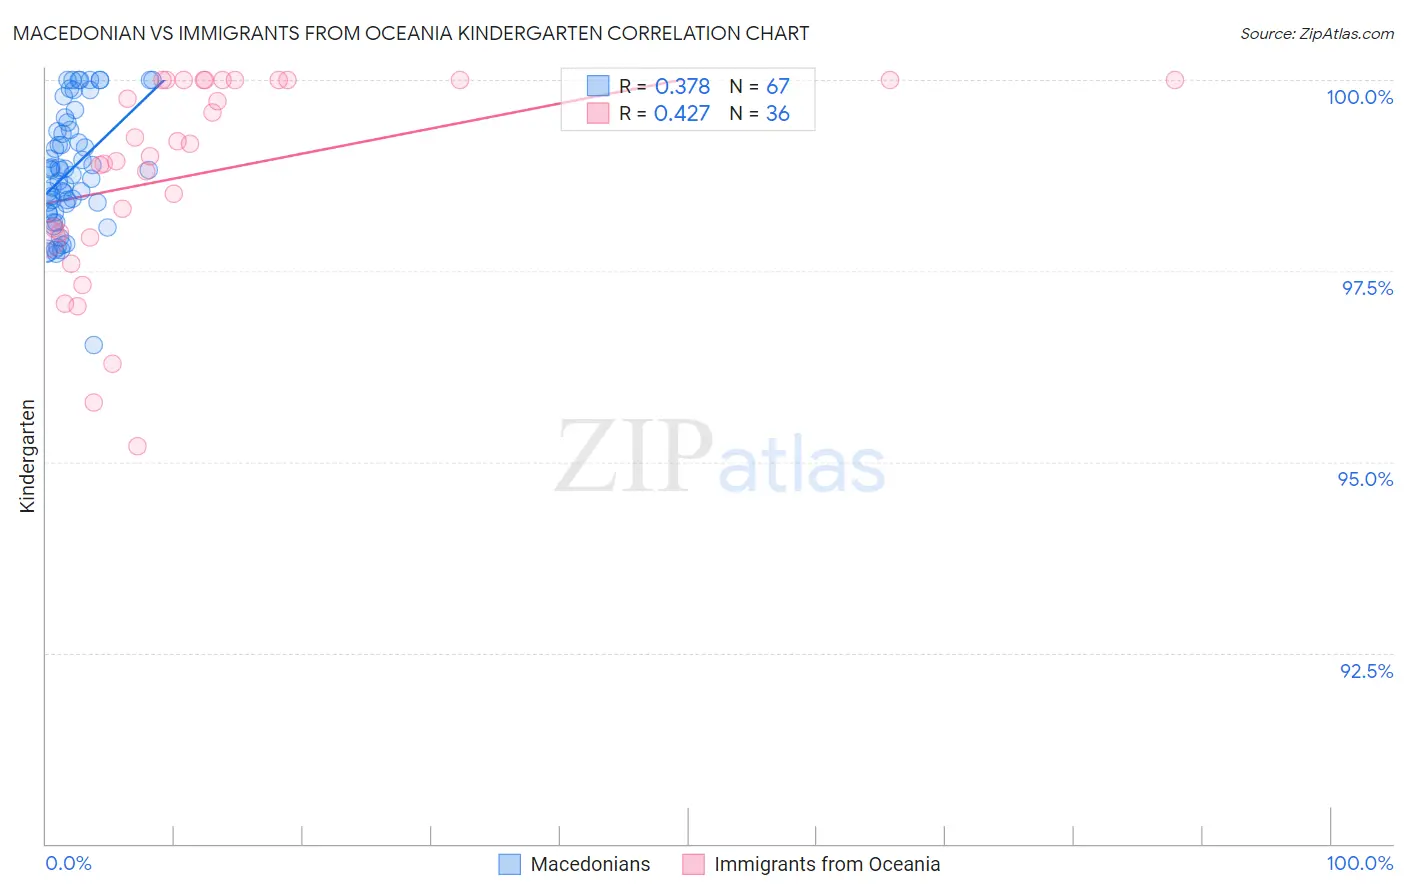
Macedonian vs Immigrants from Oceania Kindergarten Correlation Chart
The statistical analysis conducted on geographies consisting of 132,590,497 people shows a mild positive correlation between the proportion of Macedonians and percentage of population with at least kindergarten education in the United States with a correlation coefficient (R) of 0.378 and weighted average of 98.3%. Similarly, the statistical analysis conducted on geographies consisting of 305,516,300 people shows a moderate positive correlation between the proportion of Immigrants from Oceania and percentage of population with at least kindergarten education in the United States with a correlation coefficient (R) of 0.427 and weighted average of 97.8%, a difference of 0.49%.
Kindergarten Correlation Summary
| Measurement | Macedonian | Immigrants from Oceania |
| Minimum | 96.5% | 95.2% |
| Maximum | 100.0% | 100.0% |
| Range | 3.5% | 4.8% |
| Mean | 98.8% | 98.8% |
| Median | 98.8% | 99.1% |
| Interquartile 25% (IQ1) | 98.3% | 98.0% |
| Interquartile 75% (IQ3) | 99.3% | 100.0% |
| Interquartile Range (IQR) | 1.1% | 2.0% |
| Standard Deviation (Sample) | 0.77% | 1.3% |
| Standard Deviation (Population) | 0.76% | 1.3% |
Similar Demographics by Kindergarten
Demographics Similar to Macedonians by Kindergarten
In terms of kindergarten, the demographic groups most similar to Macedonians are Zimbabwean (98.3%, a difference of 0.0%), Immigrants from Western Europe (98.3%, a difference of 0.0%), Ukrainian (98.3%, a difference of 0.010%), Immigrants from South Africa (98.3%, a difference of 0.010%), and Immigrants from India (98.3%, a difference of 0.010%).
| Demographics | Rating | Rank | Kindergarten |
| Immigrants | Sweden | 99.1 /100 | #85 | Exceptional 98.3% |
| Hopi | 99.0 /100 | #86 | Exceptional 98.3% |
| Immigrants | Australia | 99.0 /100 | #87 | Exceptional 98.3% |
| Ukrainians | 98.8 /100 | #88 | Exceptional 98.3% |
| Immigrants | South Africa | 98.8 /100 | #89 | Exceptional 98.3% |
| Zimbabweans | 98.8 /100 | #90 | Exceptional 98.3% |
| Immigrants | Western Europe | 98.8 /100 | #91 | Exceptional 98.3% |
| Macedonians | 98.7 /100 | #92 | Exceptional 98.3% |
| Immigrants | India | 98.6 /100 | #93 | Exceptional 98.3% |
| South Africans | 98.5 /100 | #94 | Exceptional 98.3% |
| Immigrants | Germany | 98.5 /100 | #95 | Exceptional 98.3% |
| Immigrants | Nonimmigrants | 98.3 /100 | #96 | Exceptional 98.3% |
| Cypriots | 98.3 /100 | #97 | Exceptional 98.3% |
| Choctaw | 98.2 /100 | #98 | Exceptional 98.3% |
| Colville | 98.2 /100 | #99 | Exceptional 98.3% |
Demographics Similar to Immigrants from Oceania by Kindergarten
In terms of kindergarten, the demographic groups most similar to Immigrants from Oceania are Costa Rican (97.8%, a difference of 0.0%), Laotian (97.8%, a difference of 0.0%), Immigrants from Northern Africa (97.8%, a difference of 0.010%), Moroccan (97.8%, a difference of 0.020%), and Immigrants from Albania (97.8%, a difference of 0.030%).
| Demographics | Rating | Rank | Kindergarten |
| Immigrants | Uganda | 18.8 /100 | #203 | Poor 97.8% |
| Immigrants | Chile | 18.1 /100 | #204 | Poor 97.8% |
| Immigrants | Southern Europe | 18.0 /100 | #205 | Poor 97.8% |
| Immigrants | Albania | 16.4 /100 | #206 | Poor 97.8% |
| Africans | 16.1 /100 | #207 | Poor 97.8% |
| Immigrants | Northern Africa | 12.0 /100 | #208 | Poor 97.8% |
| Costa Ricans | 11.6 /100 | #209 | Poor 97.8% |
| Immigrants | Oceania | 11.1 /100 | #210 | Poor 97.8% |
| Laotians | 10.5 /100 | #211 | Poor 97.8% |
| Moroccans | 8.9 /100 | #212 | Tragic 97.8% |
| South American Indians | 7.7 /100 | #213 | Tragic 97.8% |
| Uruguayans | 7.5 /100 | #214 | Tragic 97.8% |
| Immigrants | Bahamas | 7.4 /100 | #215 | Tragic 97.8% |
| Samoans | 6.9 /100 | #216 | Tragic 97.8% |
| Bahamians | 6.6 /100 | #217 | Tragic 97.8% |