British vs Cambodian 8th Grade
COMPARE
British
Cambodian
8th Grade
8th Grade Comparison
British
Cambodians
97.0%
8TH GRADE
100.0/ 100
METRIC RATING
38th/ 347
METRIC RANK
96.1%
8TH GRADE
90.6/ 100
METRIC RATING
137th/ 347
METRIC RANK
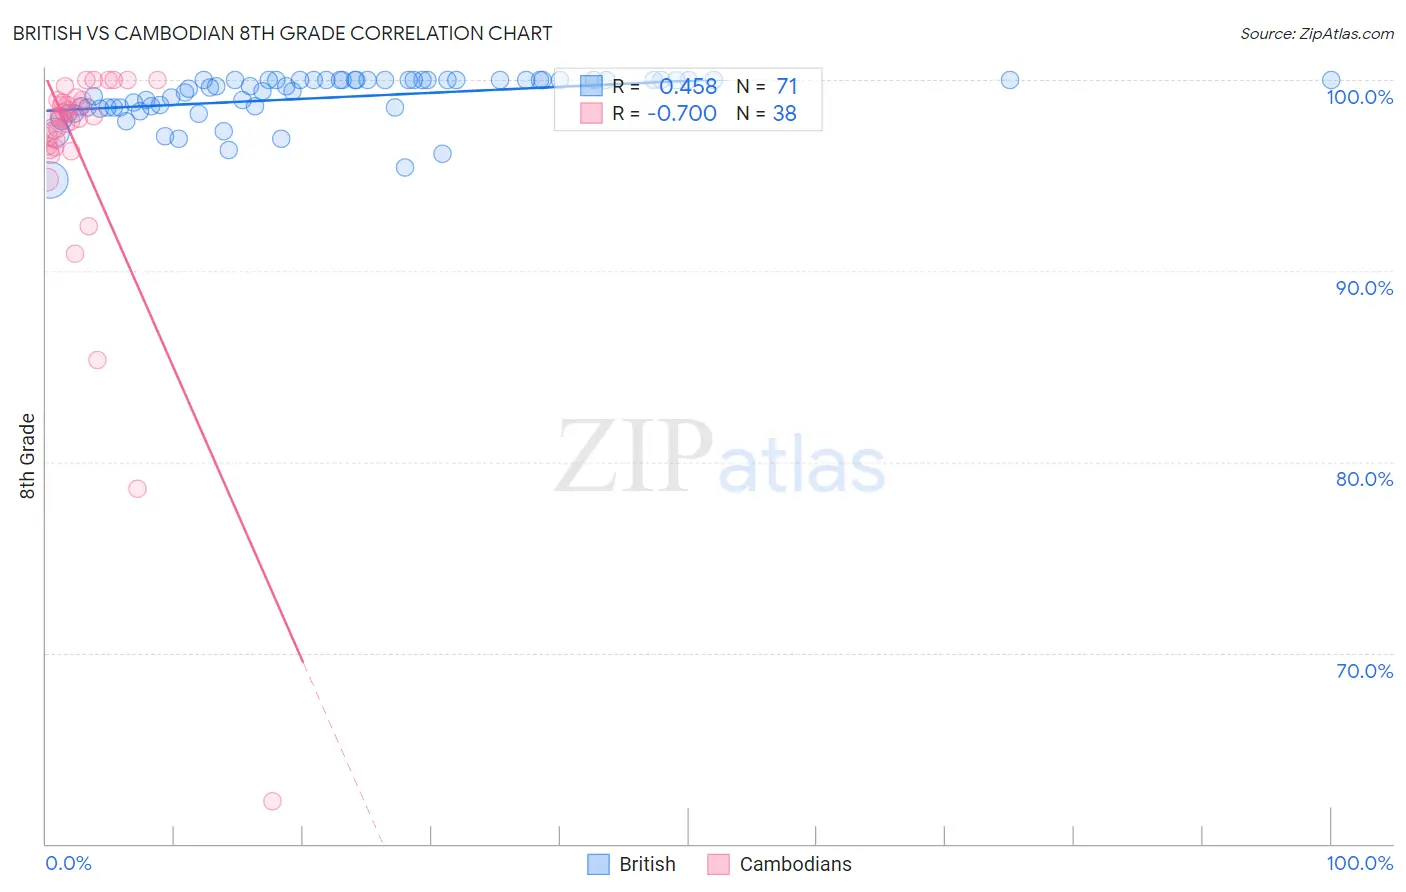
British vs Cambodian 8th Grade Correlation Chart
The statistical analysis conducted on geographies consisting of 531,463,582 people shows a moderate positive correlation between the proportion of British and percentage of population with at least 8th grade education in the United States with a correlation coefficient (R) of 0.458 and weighted average of 97.0%. Similarly, the statistical analysis conducted on geographies consisting of 102,514,976 people shows a significant negative correlation between the proportion of Cambodians and percentage of population with at least 8th grade education in the United States with a correlation coefficient (R) of -0.700 and weighted average of 96.1%, a difference of 0.93%.
8th Grade Correlation Summary
| Measurement | British | Cambodian |
| Minimum | 94.8% | 62.2% |
| Maximum | 100.0% | 100.0% |
| Range | 5.2% | 37.8% |
| Mean | 99.1% | 96.0% |
| Median | 99.6% | 98.0% |
| Interquartile 25% (IQ1) | 98.6% | 96.5% |
| Interquartile 75% (IQ3) | 100.0% | 98.9% |
| Interquartile Range (IQR) | 1.4% | 2.5% |
| Standard Deviation (Sample) | 1.2% | 7.0% |
| Standard Deviation (Population) | 1.2% | 6.9% |
Similar Demographics by 8th Grade
Demographics Similar to British by 8th Grade
In terms of 8th grade, the demographic groups most similar to British are Hungarian (97.0%, a difference of 0.0%), Belgian (97.0%, a difference of 0.020%), Latvian (97.0%, a difference of 0.020%), Inupiat (97.0%, a difference of 0.020%), and Eastern European (97.0%, a difference of 0.020%).
| Demographics | Rating | Rank | 8th Grade |
| Chippewa | 100.0 /100 | #31 | Exceptional 97.1% |
| Yup'ik | 100.0 /100 | #32 | Exceptional 97.0% |
| Swiss | 100.0 /100 | #33 | Exceptional 97.0% |
| Luxembourgers | 100.0 /100 | #34 | Exceptional 97.0% |
| Alaska Natives | 100.0 /100 | #35 | Exceptional 97.0% |
| Belgians | 100.0 /100 | #36 | Exceptional 97.0% |
| Latvians | 100.0 /100 | #37 | Exceptional 97.0% |
| British | 100.0 /100 | #38 | Exceptional 97.0% |
| Hungarians | 100.0 /100 | #39 | Exceptional 97.0% |
| Inupiat | 100.0 /100 | #40 | Exceptional 97.0% |
| Eastern Europeans | 100.0 /100 | #41 | Exceptional 97.0% |
| Chinese | 100.0 /100 | #42 | Exceptional 96.9% |
| Aleuts | 99.9 /100 | #43 | Exceptional 96.9% |
| Maltese | 99.9 /100 | #44 | Exceptional 96.9% |
| Northern Europeans | 99.9 /100 | #45 | Exceptional 96.9% |
Demographics Similar to Cambodians by 8th Grade
In terms of 8th grade, the demographic groups most similar to Cambodians are Jordanian (96.1%, a difference of 0.010%), Burmese (96.1%, a difference of 0.010%), Immigrants from Turkey (96.1%, a difference of 0.020%), Immigrants from Hungary (96.1%, a difference of 0.020%), and Basque (96.1%, a difference of 0.020%).
| Demographics | Rating | Rank | 8th Grade |
| Soviet Union | 92.6 /100 | #130 | Exceptional 96.1% |
| Pueblo | 92.3 /100 | #131 | Exceptional 96.1% |
| Immigrants | Kuwait | 92.2 /100 | #132 | Exceptional 96.1% |
| Immigrants | Turkey | 91.7 /100 | #133 | Exceptional 96.1% |
| Immigrants | Hungary | 91.5 /100 | #134 | Exceptional 96.1% |
| Basques | 91.5 /100 | #135 | Exceptional 96.1% |
| Jordanians | 91.3 /100 | #136 | Exceptional 96.1% |
| Cambodians | 90.6 /100 | #137 | Exceptional 96.1% |
| Burmese | 90.2 /100 | #138 | Exceptional 96.1% |
| Hmong | 89.7 /100 | #139 | Excellent 96.1% |
| Immigrants | South Central Asia | 89.4 /100 | #140 | Excellent 96.1% |
| Immigrants | Greece | 85.9 /100 | #141 | Excellent 96.0% |
| Immigrants | Eastern Europe | 85.4 /100 | #142 | Excellent 96.0% |
| Spanish | 85.1 /100 | #143 | Excellent 96.0% |
| Immigrants | Belarus | 84.8 /100 | #144 | Excellent 96.0% |