Dutch vs Mexican 12th Grade, No Diploma
COMPARE
Dutch
Mexican
12th Grade, No Diploma
12th Grade, No Diploma Comparison
Dutch
Mexicans
92.9%
12TH GRADE, NO DIPLOMA
99.8/ 100
METRIC RATING
44th/ 347
METRIC RANK
84.1%
12TH GRADE, NO DIPLOMA
0.0/ 100
METRIC RATING
340th/ 347
METRIC RANK
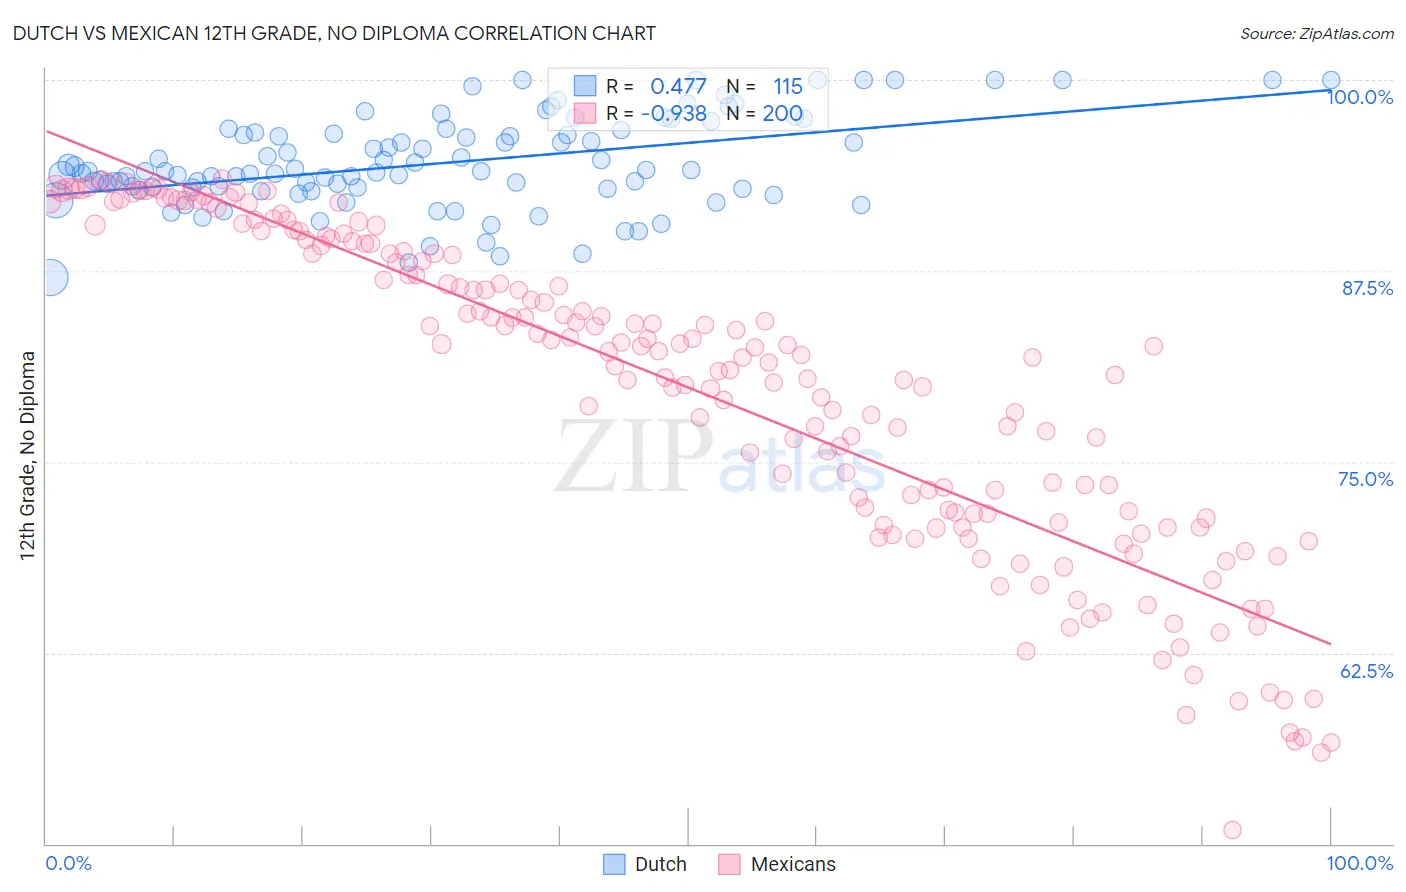
Dutch vs Mexican 12th Grade, No Diploma Correlation Chart
The statistical analysis conducted on geographies consisting of 554,358,405 people shows a moderate positive correlation between the proportion of Dutch and percentage of population with at least 12th grade (no diploma) education in the United States with a correlation coefficient (R) of 0.477 and weighted average of 92.9%. Similarly, the statistical analysis conducted on geographies consisting of 565,338,354 people shows a near-perfect negative correlation between the proportion of Mexicans and percentage of population with at least 12th grade (no diploma) education in the United States with a correlation coefficient (R) of -0.938 and weighted average of 84.1%, a difference of 10.5%.
12th Grade, No Diploma Correlation Summary
| Measurement | Dutch | Mexican |
| Minimum | 87.1% | 50.9% |
| Maximum | 100.0% | 93.5% |
| Range | 12.9% | 42.6% |
| Mean | 94.6% | 79.9% |
| Median | 94.0% | 82.2% |
| Interquartile 25% (IQ1) | 92.9% | 71.6% |
| Interquartile 75% (IQ3) | 96.5% | 89.2% |
| Interquartile Range (IQR) | 3.6% | 17.6% |
| Standard Deviation (Sample) | 3.0% | 10.4% |
| Standard Deviation (Population) | 2.9% | 10.3% |
Similar Demographics by 12th Grade, No Diploma
Demographics Similar to Dutch by 12th Grade, No Diploma
In terms of 12th grade, no diploma, the demographic groups most similar to Dutch are Northern European (92.9%, a difference of 0.0%), Greek (92.9%, a difference of 0.010%), Immigrants from Australia (92.9%, a difference of 0.020%), British (92.9%, a difference of 0.020%), and Belgian (92.9%, a difference of 0.030%).
| Demographics | Rating | Rank | 12th Grade, No Diploma |
| Irish | 99.9 /100 | #37 | Exceptional 93.0% |
| Tlingit-Haida | 99.8 /100 | #38 | Exceptional 93.0% |
| Immigrants | Austria | 99.8 /100 | #39 | Exceptional 93.0% |
| Turks | 99.8 /100 | #40 | Exceptional 93.0% |
| Bhutanese | 99.8 /100 | #41 | Exceptional 93.0% |
| Immigrants | Australia | 99.8 /100 | #42 | Exceptional 92.9% |
| Northern Europeans | 99.8 /100 | #43 | Exceptional 92.9% |
| Dutch | 99.8 /100 | #44 | Exceptional 92.9% |
| Greeks | 99.8 /100 | #45 | Exceptional 92.9% |
| British | 99.8 /100 | #46 | Exceptional 92.9% |
| Belgians | 99.8 /100 | #47 | Exceptional 92.9% |
| Australians | 99.8 /100 | #48 | Exceptional 92.9% |
| Macedonians | 99.8 /100 | #49 | Exceptional 92.9% |
| Tsimshian | 99.8 /100 | #50 | Exceptional 92.9% |
| Immigrants | Belgium | 99.8 /100 | #51 | Exceptional 92.9% |
Demographics Similar to Mexicans by 12th Grade, No Diploma
In terms of 12th grade, no diploma, the demographic groups most similar to Mexicans are Immigrants from Guatemala (84.0%, a difference of 0.14%), Salvadoran (84.5%, a difference of 0.41%), Houma (83.7%, a difference of 0.48%), Guatemalan (84.6%, a difference of 0.51%), and Pima (84.6%, a difference of 0.56%).
| Demographics | Rating | Rank | 12th Grade, No Diploma |
| Immigrants | Latin America | 0.0 /100 | #333 | Tragic 85.0% |
| Immigrants | Dominican Republic | 0.0 /100 | #334 | Tragic 84.9% |
| Immigrants | Yemen | 0.0 /100 | #335 | Tragic 84.8% |
| Tohono O'odham | 0.0 /100 | #336 | Tragic 84.7% |
| Pima | 0.0 /100 | #337 | Tragic 84.6% |
| Guatemalans | 0.0 /100 | #338 | Tragic 84.6% |
| Salvadorans | 0.0 /100 | #339 | Tragic 84.5% |
| Mexicans | 0.0 /100 | #340 | Tragic 84.1% |
| Immigrants | Guatemala | 0.0 /100 | #341 | Tragic 84.0% |
| Houma | 0.0 /100 | #342 | Tragic 83.7% |
| Immigrants | El Salvador | 0.0 /100 | #343 | Tragic 83.6% |
| Immigrants | Central America | 0.0 /100 | #344 | Tragic 83.0% |
| Spanish American Indians | 0.0 /100 | #345 | Tragic 82.9% |
| Yakama | 0.0 /100 | #346 | Tragic 82.5% |
| Immigrants | Mexico | 0.0 /100 | #347 | Tragic 82.4% |