Immigrants from Korea vs Mexican 12th Grade, No Diploma
COMPARE
Immigrants from Korea
Mexican
12th Grade, No Diploma
12th Grade, No Diploma Comparison
Immigrants from Korea
Mexicans
92.3%
12TH GRADE, NO DIPLOMA
98.3/ 100
METRIC RATING
99th/ 347
METRIC RANK
84.1%
12TH GRADE, NO DIPLOMA
0.0/ 100
METRIC RATING
340th/ 347
METRIC RANK
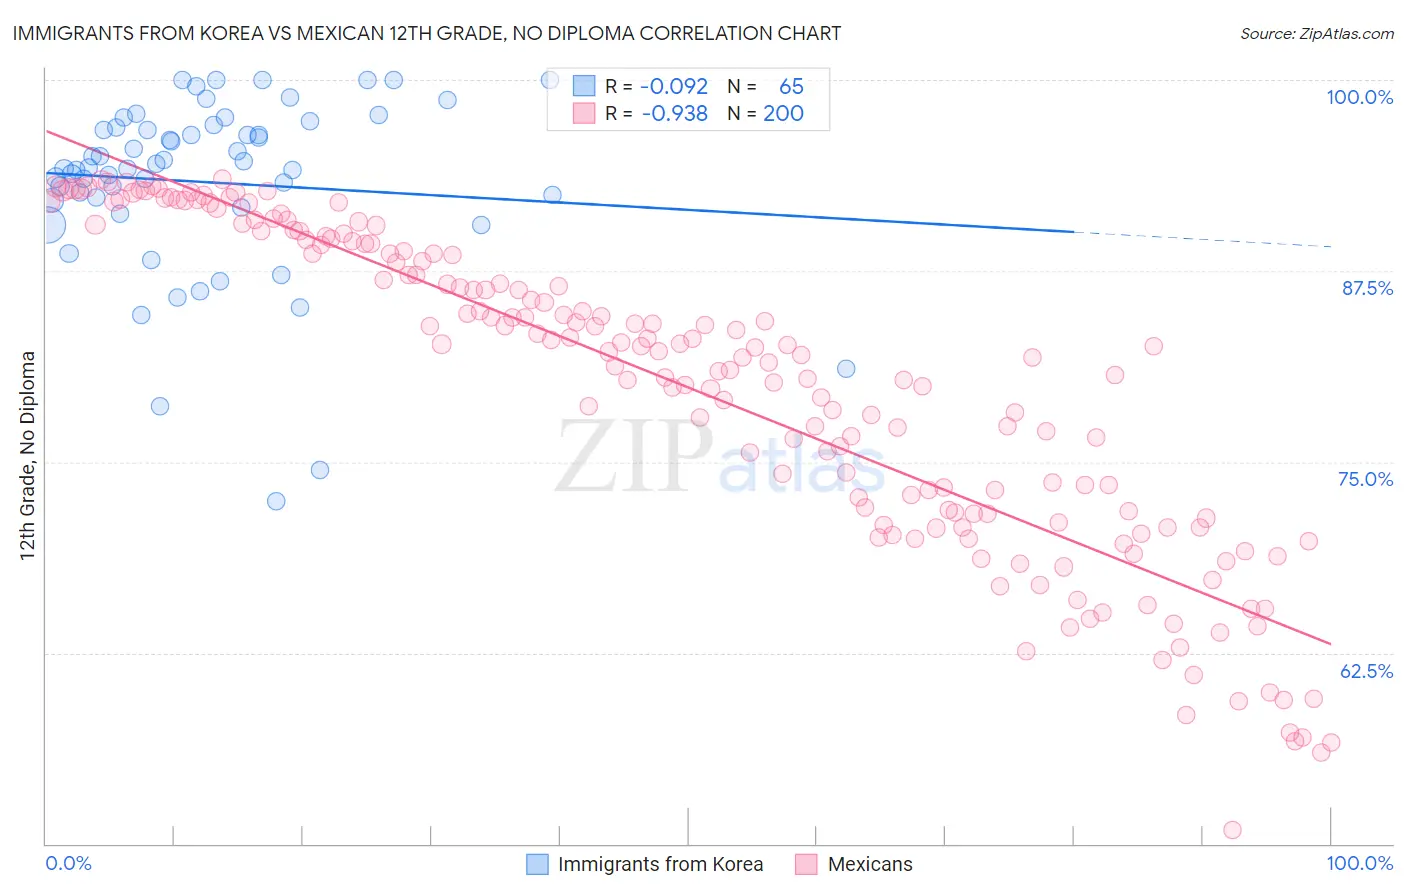
Immigrants from Korea vs Mexican 12th Grade, No Diploma Correlation Chart
The statistical analysis conducted on geographies consisting of 416,280,217 people shows a slight negative correlation between the proportion of Immigrants from Korea and percentage of population with at least 12th grade (no diploma) education in the United States with a correlation coefficient (R) of -0.092 and weighted average of 92.3%. Similarly, the statistical analysis conducted on geographies consisting of 565,338,354 people shows a near-perfect negative correlation between the proportion of Mexicans and percentage of population with at least 12th grade (no diploma) education in the United States with a correlation coefficient (R) of -0.938 and weighted average of 84.1%, a difference of 9.7%.
12th Grade, No Diploma Correlation Summary
| Measurement | Immigrants from Korea | Mexican |
| Minimum | 72.4% | 50.9% |
| Maximum | 100.0% | 93.5% |
| Range | 27.6% | 42.6% |
| Mean | 93.3% | 79.9% |
| Median | 94.3% | 82.2% |
| Interquartile 25% (IQ1) | 91.9% | 71.6% |
| Interquartile 75% (IQ3) | 97.0% | 89.2% |
| Interquartile Range (IQR) | 5.1% | 17.6% |
| Standard Deviation (Sample) | 5.8% | 10.4% |
| Standard Deviation (Population) | 5.8% | 10.3% |
Similar Demographics by 12th Grade, No Diploma
Demographics Similar to Immigrants from Korea by 12th Grade, No Diploma
In terms of 12th grade, no diploma, the demographic groups most similar to Immigrants from Korea are Immigrants from Croatia (92.3%, a difference of 0.010%), Icelander (92.3%, a difference of 0.020%), Celtic (92.3%, a difference of 0.020%), Immigrants from Kuwait (92.3%, a difference of 0.020%), and Immigrants from Europe (92.3%, a difference of 0.030%).
| Demographics | Rating | Rank | 12th Grade, No Diploma |
| Immigrants | Romania | 98.5 /100 | #92 | Exceptional 92.3% |
| Immigrants | Western Europe | 98.5 /100 | #93 | Exceptional 92.3% |
| Immigrants | Europe | 98.5 /100 | #94 | Exceptional 92.3% |
| Immigrants | North Macedonia | 98.5 /100 | #95 | Exceptional 92.3% |
| Icelanders | 98.5 /100 | #96 | Exceptional 92.3% |
| Celtics | 98.4 /100 | #97 | Exceptional 92.3% |
| Immigrants | Kuwait | 98.4 /100 | #98 | Exceptional 92.3% |
| Immigrants | Korea | 98.3 /100 | #99 | Exceptional 92.3% |
| Immigrants | Croatia | 98.3 /100 | #100 | Exceptional 92.3% |
| Swiss | 98.1 /100 | #101 | Exceptional 92.3% |
| Alaskan Athabascans | 98.1 /100 | #102 | Exceptional 92.3% |
| Immigrants | Norway | 98.1 /100 | #103 | Exceptional 92.3% |
| Lebanese | 97.6 /100 | #104 | Exceptional 92.2% |
| Immigrants | Belarus | 97.4 /100 | #105 | Exceptional 92.2% |
| Immigrants | Russia | 97.3 /100 | #106 | Exceptional 92.2% |
Demographics Similar to Mexicans by 12th Grade, No Diploma
In terms of 12th grade, no diploma, the demographic groups most similar to Mexicans are Immigrants from Guatemala (84.0%, a difference of 0.14%), Salvadoran (84.5%, a difference of 0.41%), Houma (83.7%, a difference of 0.48%), Guatemalan (84.6%, a difference of 0.51%), and Pima (84.6%, a difference of 0.56%).
| Demographics | Rating | Rank | 12th Grade, No Diploma |
| Immigrants | Latin America | 0.0 /100 | #333 | Tragic 85.0% |
| Immigrants | Dominican Republic | 0.0 /100 | #334 | Tragic 84.9% |
| Immigrants | Yemen | 0.0 /100 | #335 | Tragic 84.8% |
| Tohono O'odham | 0.0 /100 | #336 | Tragic 84.7% |
| Pima | 0.0 /100 | #337 | Tragic 84.6% |
| Guatemalans | 0.0 /100 | #338 | Tragic 84.6% |
| Salvadorans | 0.0 /100 | #339 | Tragic 84.5% |
| Mexicans | 0.0 /100 | #340 | Tragic 84.1% |
| Immigrants | Guatemala | 0.0 /100 | #341 | Tragic 84.0% |
| Houma | 0.0 /100 | #342 | Tragic 83.7% |
| Immigrants | El Salvador | 0.0 /100 | #343 | Tragic 83.6% |
| Immigrants | Central America | 0.0 /100 | #344 | Tragic 83.0% |
| Spanish American Indians | 0.0 /100 | #345 | Tragic 82.9% |
| Yakama | 0.0 /100 | #346 | Tragic 82.5% |
| Immigrants | Mexico | 0.0 /100 | #347 | Tragic 82.4% |