Brazilian vs Immigrants from Nigeria 9th Grade
COMPARE
Brazilian
Immigrants from Nigeria
9th Grade
9th Grade Comparison
Brazilians
Immigrants from Nigeria
94.9%
9TH GRADE
49.8/ 100
METRIC RATING
175th/ 347
METRIC RANK
94.0%
9TH GRADE
0.6/ 100
METRIC RATING
255th/ 347
METRIC RANK
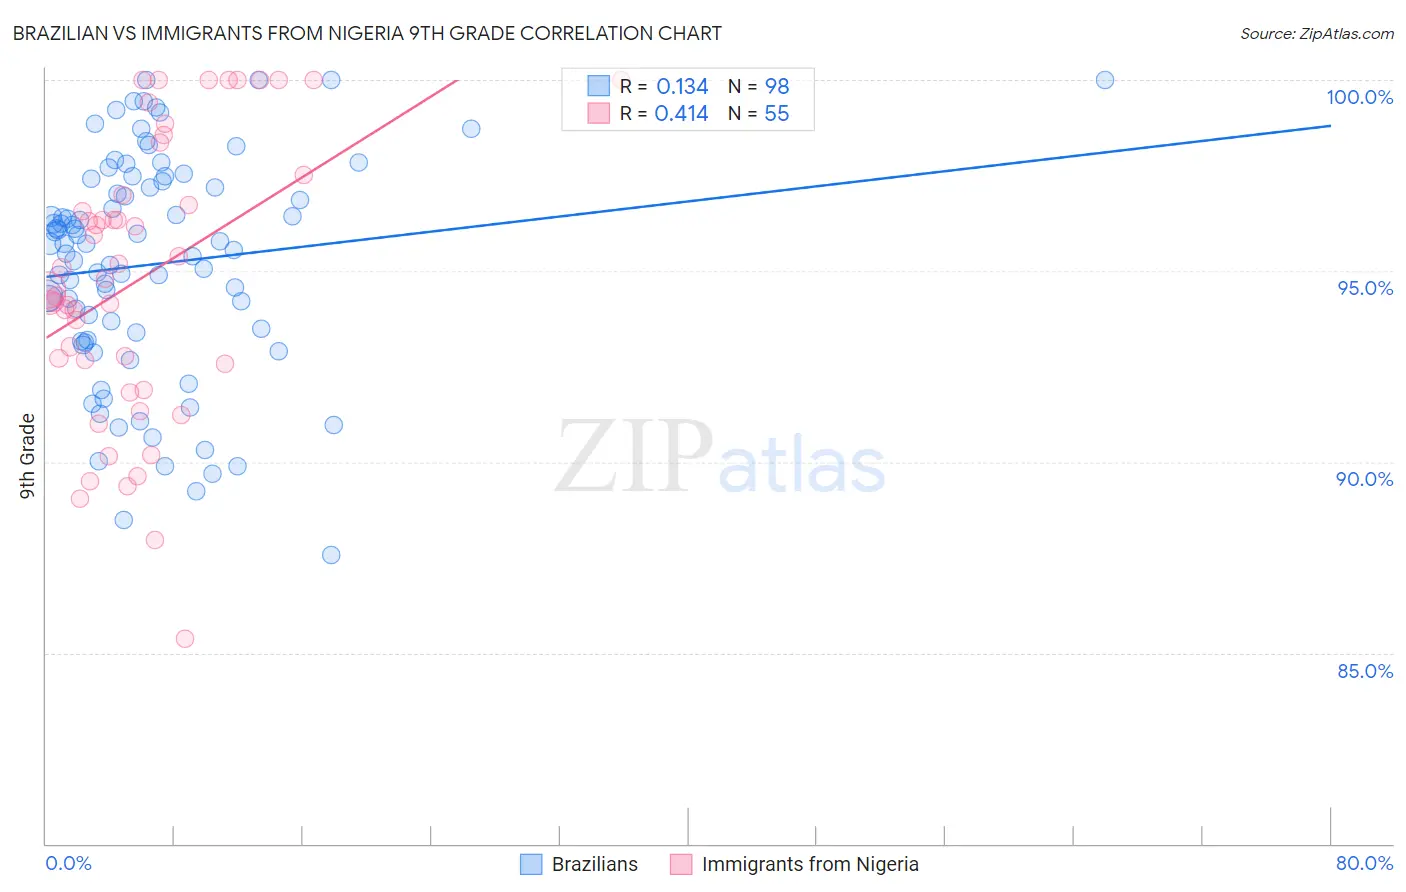
Brazilian vs Immigrants from Nigeria 9th Grade Correlation Chart
The statistical analysis conducted on geographies consisting of 323,900,771 people shows a poor positive correlation between the proportion of Brazilians and percentage of population with at least 9th grade education in the United States with a correlation coefficient (R) of 0.134 and weighted average of 94.9%. Similarly, the statistical analysis conducted on geographies consisting of 283,441,873 people shows a moderate positive correlation between the proportion of Immigrants from Nigeria and percentage of population with at least 9th grade education in the United States with a correlation coefficient (R) of 0.414 and weighted average of 94.0%, a difference of 0.95%.
9th Grade Correlation Summary
| Measurement | Brazilian | Immigrants from Nigeria |
| Minimum | 87.6% | 85.4% |
| Maximum | 100.0% | 100.0% |
| Range | 12.4% | 14.6% |
| Mean | 95.2% | 94.8% |
| Median | 95.7% | 94.8% |
| Interquartile 25% (IQ1) | 93.2% | 92.6% |
| Interquartile 75% (IQ3) | 97.3% | 97.5% |
| Interquartile Range (IQR) | 4.1% | 5.0% |
| Standard Deviation (Sample) | 2.9% | 3.7% |
| Standard Deviation (Population) | 2.9% | 3.6% |
Similar Demographics by 9th Grade
Demographics Similar to Brazilians by 9th Grade
In terms of 9th grade, the demographic groups most similar to Brazilians are Immigrants from Egypt (94.9%, a difference of 0.0%), Cheyenne (94.9%, a difference of 0.010%), Immigrants from Spain (94.9%, a difference of 0.010%), Immigrants from Iraq (94.9%, a difference of 0.010%), and Immigrants from Poland (94.9%, a difference of 0.020%).
| Demographics | Rating | Rank | 9th Grade |
| Chileans | 60.7 /100 | #168 | Good 95.0% |
| Spaniards | 59.6 /100 | #169 | Average 94.9% |
| Alsatians | 58.6 /100 | #170 | Average 94.9% |
| Colville | 58.5 /100 | #171 | Average 94.9% |
| Iraqis | 54.0 /100 | #172 | Average 94.9% |
| Cheyenne | 51.5 /100 | #173 | Average 94.9% |
| Immigrants | Egypt | 50.0 /100 | #174 | Average 94.9% |
| Brazilians | 49.8 /100 | #175 | Average 94.9% |
| Immigrants | Spain | 49.1 /100 | #176 | Average 94.9% |
| Immigrants | Iraq | 47.8 /100 | #177 | Average 94.9% |
| Immigrants | Poland | 46.7 /100 | #178 | Average 94.9% |
| Immigrants | Venezuela | 46.5 /100 | #179 | Average 94.9% |
| Immigrants | Uganda | 43.1 /100 | #180 | Average 94.8% |
| Sierra Leoneans | 42.7 /100 | #181 | Average 94.8% |
| Seminole | 42.5 /100 | #182 | Average 94.8% |
Demographics Similar to Immigrants from Nigeria by 9th Grade
In terms of 9th grade, the demographic groups most similar to Immigrants from Nigeria are Immigrants from Afghanistan (94.0%, a difference of 0.010%), Immigrants from Costa Rica (94.0%, a difference of 0.030%), Immigrants from Thailand (93.9%, a difference of 0.030%), Ghanaian (93.9%, a difference of 0.030%), and U.S. Virgin Islander (94.0%, a difference of 0.050%).
| Demographics | Rating | Rank | 9th Grade |
| Immigrants | Somalia | 1.4 /100 | #248 | Tragic 94.1% |
| Uruguayans | 1.3 /100 | #249 | Tragic 94.1% |
| Immigrants | Hong Kong | 1.3 /100 | #250 | Tragic 94.1% |
| Jamaicans | 1.0 /100 | #251 | Tragic 94.1% |
| Immigrants | Senegal | 0.9 /100 | #252 | Tragic 94.1% |
| Colombians | 0.8 /100 | #253 | Tragic 94.0% |
| U.S. Virgin Islanders | 0.7 /100 | #254 | Tragic 94.0% |
| Immigrants | Nigeria | 0.6 /100 | #255 | Tragic 94.0% |
| Immigrants | Afghanistan | 0.5 /100 | #256 | Tragic 94.0% |
| Immigrants | Costa Rica | 0.5 /100 | #257 | Tragic 94.0% |
| Immigrants | Thailand | 0.5 /100 | #258 | Tragic 93.9% |
| Ghanaians | 0.5 /100 | #259 | Tragic 93.9% |
| Pima | 0.4 /100 | #260 | Tragic 93.9% |
| South Americans | 0.4 /100 | #261 | Tragic 93.9% |
| Immigrants | Jamaica | 0.4 /100 | #262 | Tragic 93.9% |