Black/African American vs Norwegian 10th Grade
COMPARE
Black/African American
Norwegian
10th Grade
10th Grade Comparison
Blacks/African Americans
Norwegians
93.2%
10TH GRADE
6.0/ 100
METRIC RATING
227th/ 347
METRIC RANK
96.2%
10TH GRADE
100.0/ 100
METRIC RATING
1st/ 347
METRIC RANK
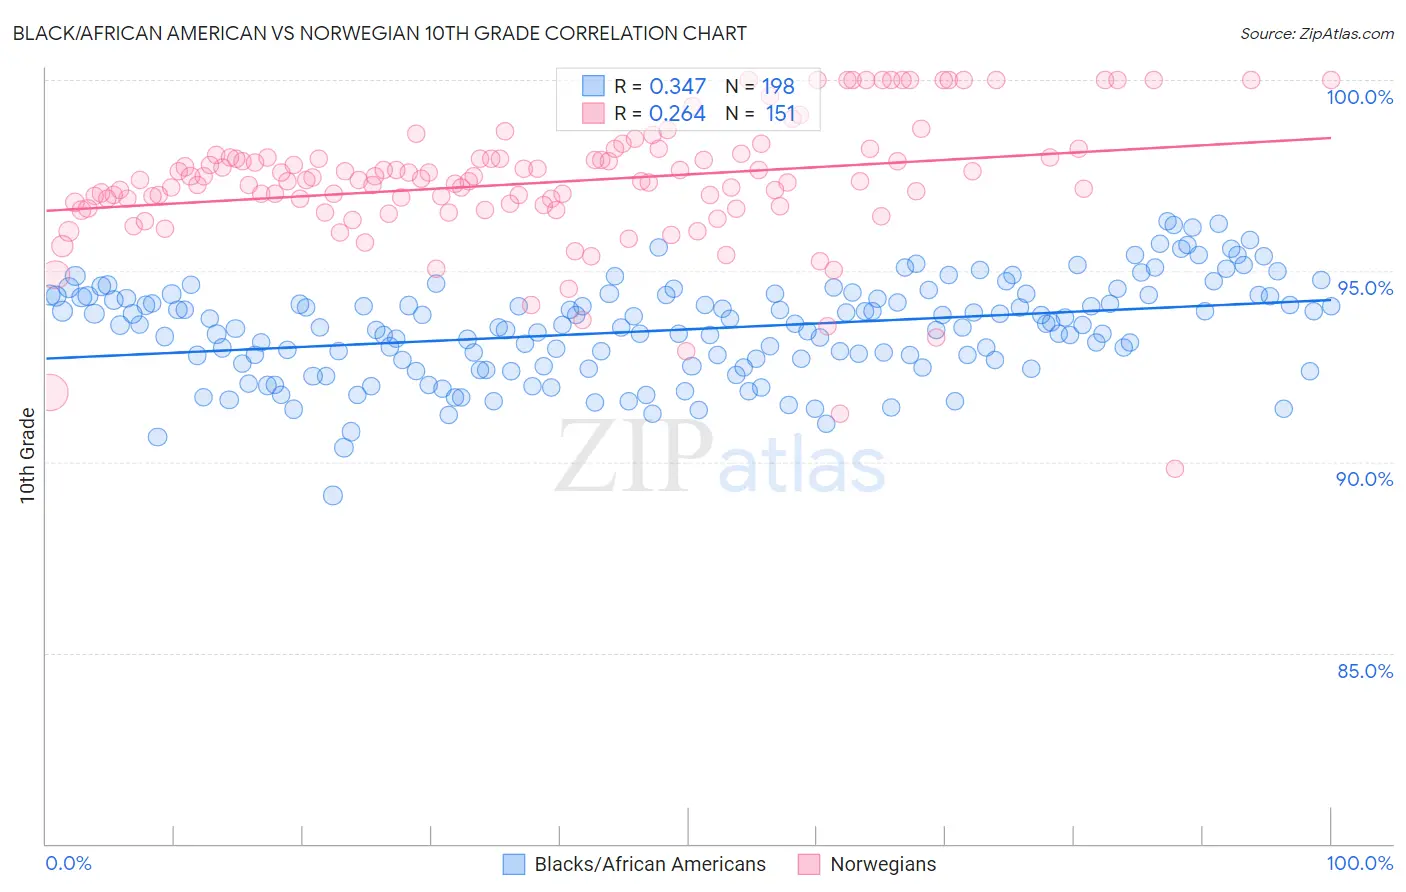
Black/African American vs Norwegian 10th Grade Correlation Chart
The statistical analysis conducted on geographies consisting of 566,038,555 people shows a mild positive correlation between the proportion of Blacks/African Americans and percentage of population with at least 10th grade education in the United States with a correlation coefficient (R) of 0.347 and weighted average of 93.2%. Similarly, the statistical analysis conducted on geographies consisting of 533,395,175 people shows a weak positive correlation between the proportion of Norwegians and percentage of population with at least 10th grade education in the United States with a correlation coefficient (R) of 0.264 and weighted average of 96.2%, a difference of 3.2%.
10th Grade Correlation Summary
| Measurement | Black/African American | Norwegian |
| Minimum | 89.1% | 89.8% |
| Maximum | 96.3% | 100.0% |
| Range | 7.2% | 10.2% |
| Mean | 93.5% | 97.3% |
| Median | 93.6% | 97.4% |
| Interquartile 25% (IQ1) | 92.6% | 96.7% |
| Interquartile 75% (IQ3) | 94.3% | 98.0% |
| Interquartile Range (IQR) | 1.8% | 1.3% |
| Standard Deviation (Sample) | 1.3% | 1.7% |
| Standard Deviation (Population) | 1.3% | 1.7% |
Similar Demographics by 10th Grade
Demographics Similar to Blacks/African Americans by 10th Grade
In terms of 10th grade, the demographic groups most similar to Blacks/African Americans are Somali (93.2%, a difference of 0.0%), Korean (93.2%, a difference of 0.0%), Immigrants from China (93.2%, a difference of 0.010%), Bolivian (93.2%, a difference of 0.020%), and Immigrants from Ethiopia (93.1%, a difference of 0.040%).
| Demographics | Rating | Rank | 10th Grade |
| Tongans | 9.5 /100 | #220 | Tragic 93.3% |
| Immigrants | Southern Europe | 8.9 /100 | #221 | Tragic 93.2% |
| Ethiopians | 7.9 /100 | #222 | Tragic 93.2% |
| Immigrants | Sierra Leone | 7.6 /100 | #223 | Tragic 93.2% |
| Bolivians | 6.7 /100 | #224 | Tragic 93.2% |
| Somalis | 6.2 /100 | #225 | Tragic 93.2% |
| Koreans | 6.1 /100 | #226 | Tragic 93.2% |
| Blacks/African Americans | 6.0 /100 | #227 | Tragic 93.2% |
| Immigrants | China | 5.9 /100 | #228 | Tragic 93.2% |
| Immigrants | Ethiopia | 5.1 /100 | #229 | Tragic 93.1% |
| Immigrants | Africa | 5.0 /100 | #230 | Tragic 93.1% |
| South American Indians | 4.9 /100 | #231 | Tragic 93.1% |
| Bahamians | 4.9 /100 | #232 | Tragic 93.1% |
| Comanche | 4.9 /100 | #233 | Tragic 93.1% |
| Sub-Saharan Africans | 4.7 /100 | #234 | Tragic 93.1% |
Demographics Similar to Norwegians by 10th Grade
In terms of 10th grade, the demographic groups most similar to Norwegians are Slovak (96.0%, a difference of 0.13%), Slovene (95.9%, a difference of 0.24%), Swedish (95.9%, a difference of 0.24%), Carpatho Rusyn (95.9%, a difference of 0.26%), and Polish (95.8%, a difference of 0.36%).
| Demographics | Rating | Rank | 10th Grade |
| Norwegians | 100.0 /100 | #1 | Exceptional 96.2% |
| Slovaks | 100.0 /100 | #2 | Exceptional 96.0% |
| Slovenes | 100.0 /100 | #3 | Exceptional 95.9% |
| Swedes | 100.0 /100 | #4 | Exceptional 95.9% |
| Carpatho Rusyns | 100.0 /100 | #5 | Exceptional 95.9% |
| Poles | 100.0 /100 | #6 | Exceptional 95.8% |
| Germans | 100.0 /100 | #7 | Exceptional 95.8% |
| Lithuanians | 100.0 /100 | #8 | Exceptional 95.8% |
| Finns | 100.0 /100 | #9 | Exceptional 95.8% |
| Croatians | 100.0 /100 | #10 | Exceptional 95.7% |
| Danes | 100.0 /100 | #11 | Exceptional 95.7% |
| Tlingit-Haida | 100.0 /100 | #12 | Exceptional 95.7% |
| English | 100.0 /100 | #13 | Exceptional 95.6% |
| Tsimshian | 100.0 /100 | #14 | Exceptional 95.6% |
| Irish | 100.0 /100 | #15 | Exceptional 95.6% |