Immigrants from Northern Africa vs Norwegian 10th Grade
COMPARE
Immigrants from Northern Africa
Norwegian
10th Grade
10th Grade Comparison
Immigrants from Northern Africa
Norwegians
93.7%
10TH GRADE
41.6/ 100
METRIC RATING
181st/ 347
METRIC RANK
96.2%
10TH GRADE
100.0/ 100
METRIC RATING
1st/ 347
METRIC RANK
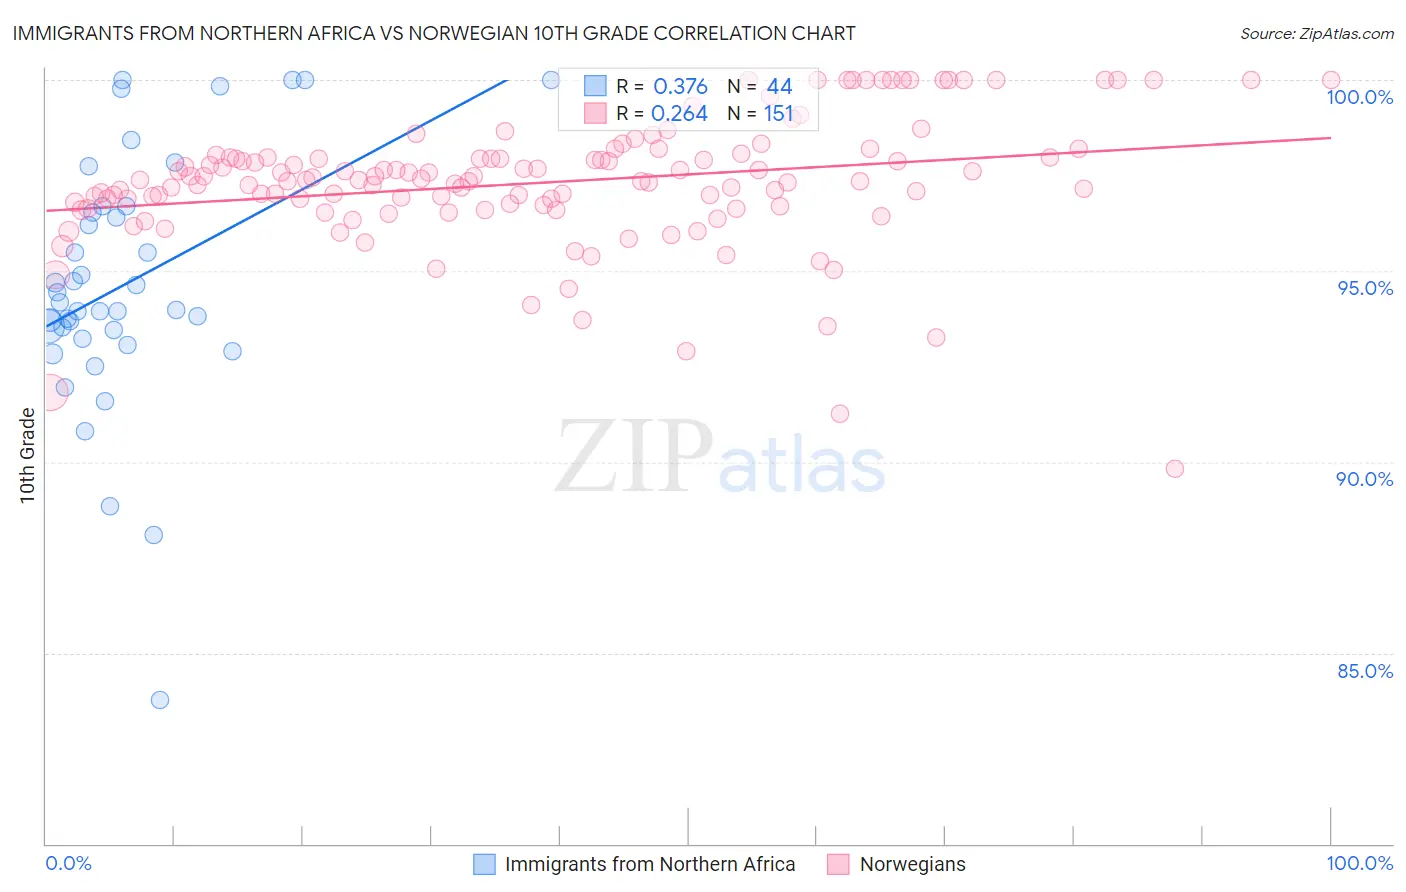
Immigrants from Northern Africa vs Norwegian 10th Grade Correlation Chart
The statistical analysis conducted on geographies consisting of 321,196,768 people shows a mild positive correlation between the proportion of Immigrants from Northern Africa and percentage of population with at least 10th grade education in the United States with a correlation coefficient (R) of 0.376 and weighted average of 93.7%. Similarly, the statistical analysis conducted on geographies consisting of 533,395,175 people shows a weak positive correlation between the proportion of Norwegians and percentage of population with at least 10th grade education in the United States with a correlation coefficient (R) of 0.264 and weighted average of 96.2%, a difference of 2.7%.
10th Grade Correlation Summary
| Measurement | Immigrants from Northern Africa | Norwegian |
| Minimum | 83.8% | 89.8% |
| Maximum | 100.0% | 100.0% |
| Range | 16.2% | 10.2% |
| Mean | 94.7% | 97.3% |
| Median | 94.1% | 97.4% |
| Interquartile 25% (IQ1) | 93.3% | 96.7% |
| Interquartile 75% (IQ3) | 96.6% | 98.0% |
| Interquartile Range (IQR) | 3.3% | 1.3% |
| Standard Deviation (Sample) | 3.3% | 1.7% |
| Standard Deviation (Population) | 3.3% | 1.7% |
Similar Demographics by 10th Grade
Demographics Similar to Immigrants from Northern Africa by 10th Grade
In terms of 10th grade, the demographic groups most similar to Immigrants from Northern Africa are Blackfeet (93.7%, a difference of 0.010%), Paraguayan (93.7%, a difference of 0.030%), Colville (93.6%, a difference of 0.030%), Sierra Leonean (93.7%, a difference of 0.040%), and Guamanian/Chamorro (93.6%, a difference of 0.040%).
| Demographics | Rating | Rank | 10th Grade |
| Argentineans | 50.0 /100 | #174 | Average 93.7% |
| Immigrants | Nepal | 49.6 /100 | #175 | Average 93.7% |
| Immigrants | Argentina | 47.1 /100 | #176 | Average 93.7% |
| Immigrants | Lebanon | 47.1 /100 | #177 | Average 93.7% |
| Sierra Leoneans | 46.1 /100 | #178 | Average 93.7% |
| Paraguayans | 45.3 /100 | #179 | Average 93.7% |
| Blackfeet | 42.8 /100 | #180 | Average 93.7% |
| Immigrants | Northern Africa | 41.6 /100 | #181 | Average 93.7% |
| Colville | 38.8 /100 | #182 | Fair 93.6% |
| Guamanians/Chamorros | 37.1 /100 | #183 | Fair 93.6% |
| Choctaw | 36.6 /100 | #184 | Fair 93.6% |
| Sudanese | 36.6 /100 | #185 | Fair 93.6% |
| Immigrants | Eastern Asia | 35.1 /100 | #186 | Fair 93.6% |
| Liberians | 34.7 /100 | #187 | Fair 93.6% |
| Marshallese | 33.2 /100 | #188 | Fair 93.6% |
Demographics Similar to Norwegians by 10th Grade
In terms of 10th grade, the demographic groups most similar to Norwegians are Slovak (96.0%, a difference of 0.13%), Slovene (95.9%, a difference of 0.24%), Swedish (95.9%, a difference of 0.24%), Carpatho Rusyn (95.9%, a difference of 0.26%), and Polish (95.8%, a difference of 0.36%).
| Demographics | Rating | Rank | 10th Grade |
| Norwegians | 100.0 /100 | #1 | Exceptional 96.2% |
| Slovaks | 100.0 /100 | #2 | Exceptional 96.0% |
| Slovenes | 100.0 /100 | #3 | Exceptional 95.9% |
| Swedes | 100.0 /100 | #4 | Exceptional 95.9% |
| Carpatho Rusyns | 100.0 /100 | #5 | Exceptional 95.9% |
| Poles | 100.0 /100 | #6 | Exceptional 95.8% |
| Germans | 100.0 /100 | #7 | Exceptional 95.8% |
| Lithuanians | 100.0 /100 | #8 | Exceptional 95.8% |
| Finns | 100.0 /100 | #9 | Exceptional 95.8% |
| Croatians | 100.0 /100 | #10 | Exceptional 95.7% |
| Danes | 100.0 /100 | #11 | Exceptional 95.7% |
| Tlingit-Haida | 100.0 /100 | #12 | Exceptional 95.7% |
| English | 100.0 /100 | #13 | Exceptional 95.6% |
| Tsimshian | 100.0 /100 | #14 | Exceptional 95.6% |
| Irish | 100.0 /100 | #15 | Exceptional 95.6% |