Black/African American vs Costa Rican 10th Grade
COMPARE
Black/African American
Costa Rican
10th Grade
10th Grade Comparison
Blacks/African Americans
Costa Ricans
93.2%
10TH GRADE
6.0/ 100
METRIC RATING
227th/ 347
METRIC RANK
93.1%
10TH GRADE
4.2/ 100
METRIC RATING
239th/ 347
METRIC RANK
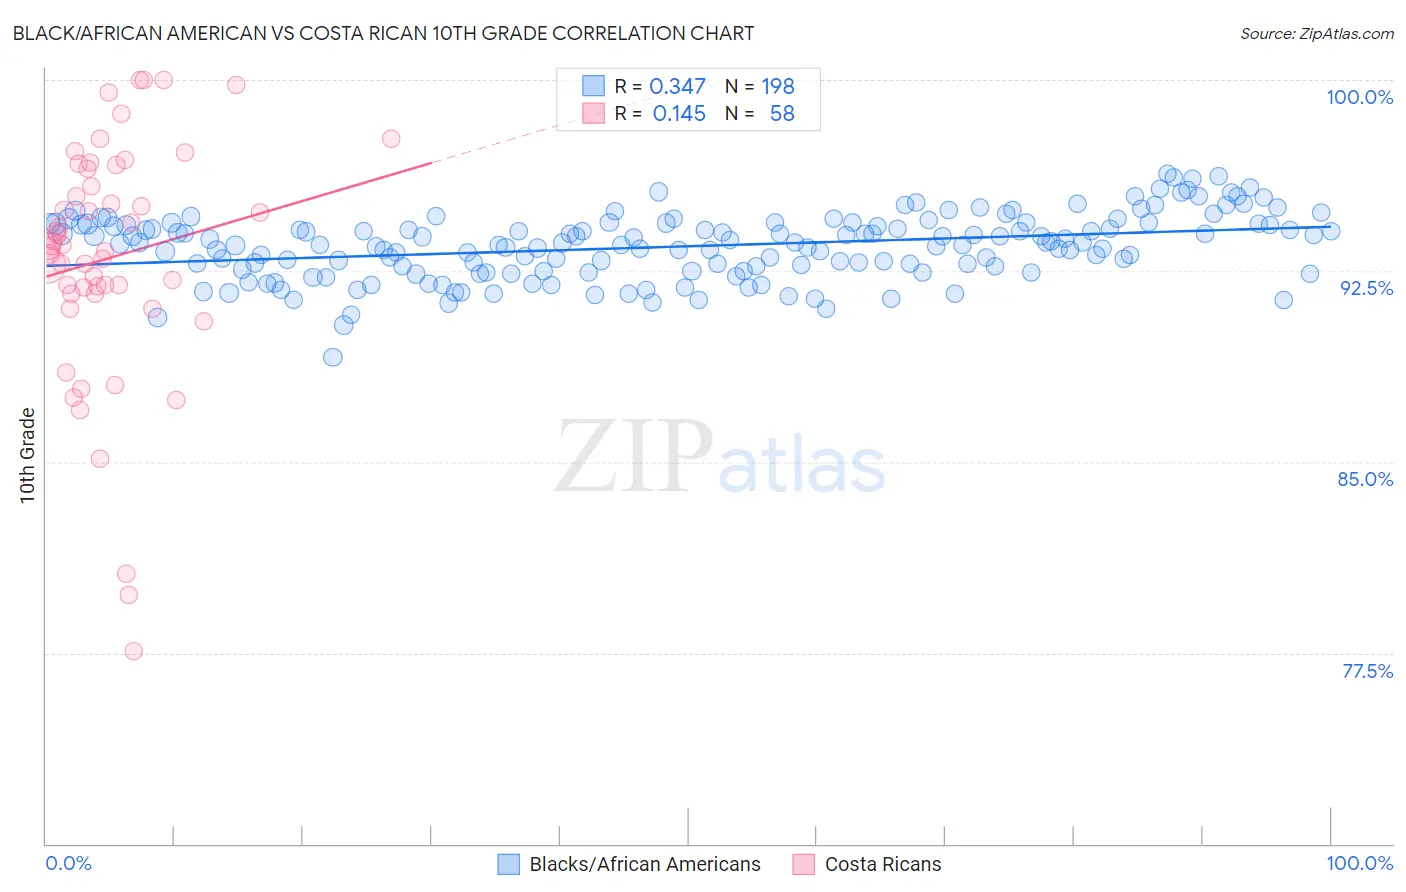
Black/African American vs Costa Rican 10th Grade Correlation Chart
The statistical analysis conducted on geographies consisting of 566,038,555 people shows a mild positive correlation between the proportion of Blacks/African Americans and percentage of population with at least 10th grade education in the United States with a correlation coefficient (R) of 0.347 and weighted average of 93.2%. Similarly, the statistical analysis conducted on geographies consisting of 253,601,730 people shows a poor positive correlation between the proportion of Costa Ricans and percentage of population with at least 10th grade education in the United States with a correlation coefficient (R) of 0.145 and weighted average of 93.1%, a difference of 0.090%.
10th Grade Correlation Summary
| Measurement | Black/African American | Costa Rican |
| Minimum | 89.1% | 77.5% |
| Maximum | 96.3% | 100.0% |
| Range | 7.2% | 22.5% |
| Mean | 93.5% | 93.0% |
| Median | 93.6% | 93.4% |
| Interquartile 25% (IQ1) | 92.6% | 91.6% |
| Interquartile 75% (IQ3) | 94.3% | 96.5% |
| Interquartile Range (IQR) | 1.8% | 4.9% |
| Standard Deviation (Sample) | 1.3% | 4.7% |
| Standard Deviation (Population) | 1.3% | 4.7% |
Demographics Similar to Blacks/African Americans and Costa Ricans by 10th Grade
In terms of 10th grade, the demographic groups most similar to Blacks/African Americans are Somali (93.2%, a difference of 0.0%), Korean (93.2%, a difference of 0.0%), Immigrants from China (93.2%, a difference of 0.010%), Bolivian (93.2%, a difference of 0.020%), and Immigrants from Ethiopia (93.1%, a difference of 0.040%). Similarly, the demographic groups most similar to Costa Ricans are Nigerian (93.1%, a difference of 0.0%), Immigrants from Hong Kong (93.1%, a difference of 0.0%), Immigrants from Panama (93.1%, a difference of 0.010%), African (93.1%, a difference of 0.020%), and Afghan (93.1%, a difference of 0.020%).
| Demographics | Rating | Rank | 10th Grade |
| Immigrants | Sierra Leone | 7.6 /100 | #223 | Tragic 93.2% |
| Bolivians | 6.7 /100 | #224 | Tragic 93.2% |
| Somalis | 6.2 /100 | #225 | Tragic 93.2% |
| Koreans | 6.1 /100 | #226 | Tragic 93.2% |
| Blacks/African Americans | 6.0 /100 | #227 | Tragic 93.2% |
| Immigrants | China | 5.9 /100 | #228 | Tragic 93.2% |
| Immigrants | Ethiopia | 5.1 /100 | #229 | Tragic 93.1% |
| Immigrants | Africa | 5.0 /100 | #230 | Tragic 93.1% |
| South American Indians | 4.9 /100 | #231 | Tragic 93.1% |
| Bahamians | 4.9 /100 | #232 | Tragic 93.1% |
| Comanche | 4.9 /100 | #233 | Tragic 93.1% |
| Sub-Saharan Africans | 4.7 /100 | #234 | Tragic 93.1% |
| Africans | 4.6 /100 | #235 | Tragic 93.1% |
| Afghans | 4.5 /100 | #236 | Tragic 93.1% |
| Immigrants | Panama | 4.3 /100 | #237 | Tragic 93.1% |
| Nigerians | 4.2 /100 | #238 | Tragic 93.1% |
| Costa Ricans | 4.2 /100 | #239 | Tragic 93.1% |
| Immigrants | Hong Kong | 4.2 /100 | #240 | Tragic 93.1% |
| Immigrants | Somalia | 2.7 /100 | #241 | Tragic 93.0% |
| Immigrants | Cameroon | 2.6 /100 | #242 | Tragic 93.0% |
| Senegalese | 2.4 /100 | #243 | Tragic 93.0% |