Swedish vs Immigrants from Lithuania 5th Grade
COMPARE
Swedish
Immigrants from Lithuania
5th Grade
5th Grade Comparison
Swedes
Immigrants from Lithuania
98.3%
5TH GRADE
100.0/ 100
METRIC RATING
9th/ 347
METRIC RANK
97.8%
5TH GRADE
99.2/ 100
METRIC RATING
79th/ 347
METRIC RANK
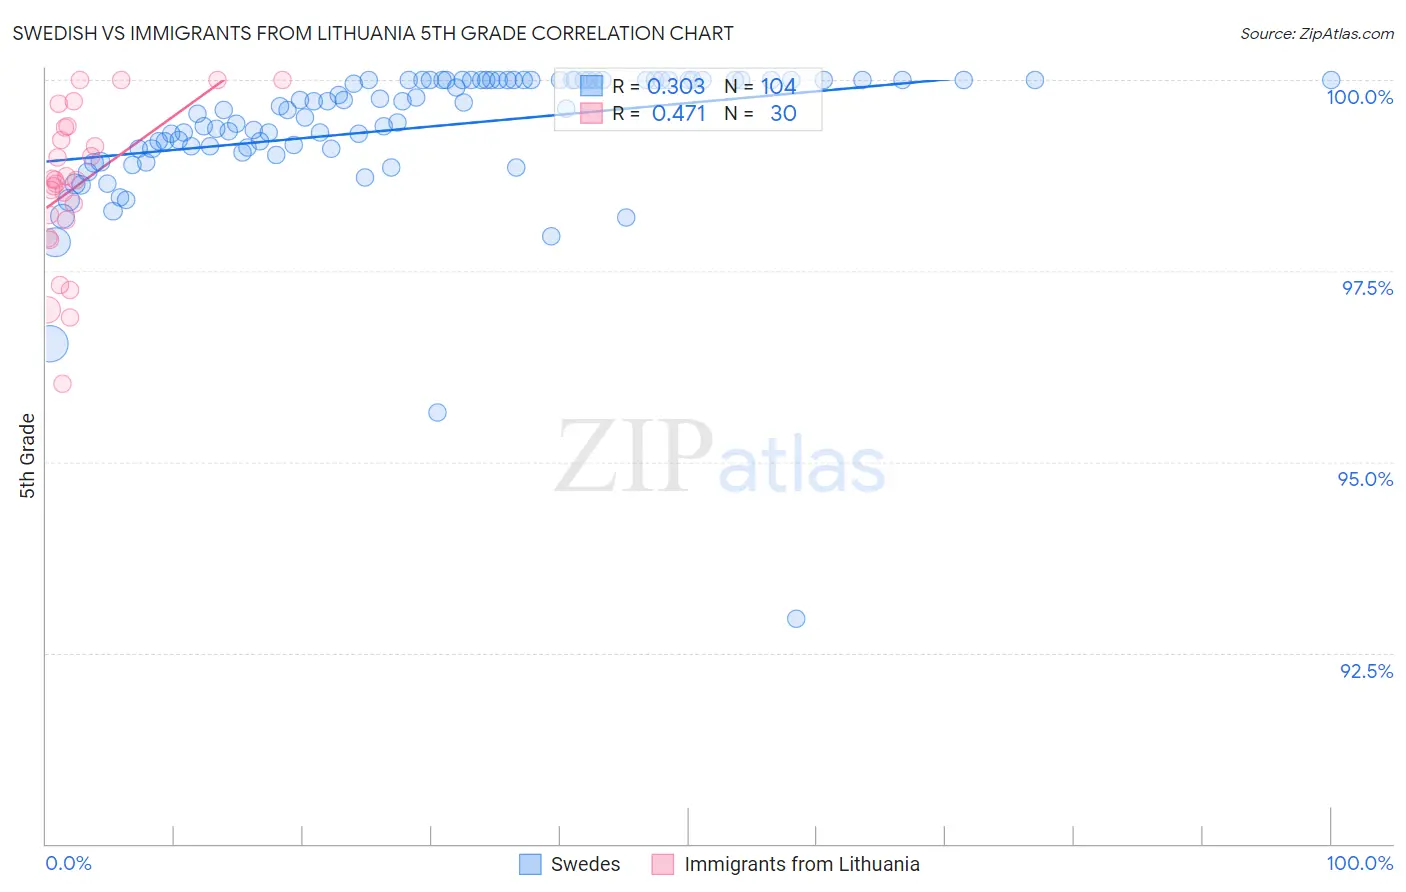
Swedish vs Immigrants from Lithuania 5th Grade Correlation Chart
The statistical analysis conducted on geographies consisting of 539,231,492 people shows a mild positive correlation between the proportion of Swedes and percentage of population with at least 5th grade education in the United States with a correlation coefficient (R) of 0.303 and weighted average of 98.3%. Similarly, the statistical analysis conducted on geographies consisting of 117,724,932 people shows a moderate positive correlation between the proportion of Immigrants from Lithuania and percentage of population with at least 5th grade education in the United States with a correlation coefficient (R) of 0.471 and weighted average of 97.8%, a difference of 0.50%.
5th Grade Correlation Summary
| Measurement | Swedish | Immigrants from Lithuania |
| Minimum | 92.9% | 96.0% |
| Maximum | 100.0% | 100.0% |
| Range | 7.1% | 4.0% |
| Mean | 99.4% | 98.6% |
| Median | 99.6% | 98.7% |
| Interquartile 25% (IQ1) | 99.1% | 98.2% |
| Interquartile 75% (IQ3) | 100.0% | 99.4% |
| Interquartile Range (IQR) | 0.90% | 1.2% |
| Standard Deviation (Sample) | 0.97% | 1.0% |
| Standard Deviation (Population) | 0.96% | 0.99% |
Similar Demographics by 5th Grade
Demographics Similar to Swedes by 5th Grade
In terms of 5th grade, the demographic groups most similar to Swedes are English (98.3%, a difference of 0.0%), Alaskan Athabascan (98.3%, a difference of 0.0%), Carpatho Rusyn (98.3%, a difference of 0.010%), Tlingit-Haida (98.3%, a difference of 0.030%), and Slovene (98.3%, a difference of 0.040%).
| Demographics | Rating | Rank | 5th Grade |
| Welsh | 100.0 /100 | #2 | Exceptional 98.6% |
| Norwegians | 100.0 /100 | #3 | Exceptional 98.4% |
| Tsimshian | 100.0 /100 | #4 | Exceptional 98.4% |
| Slovaks | 100.0 /100 | #5 | Exceptional 98.4% |
| Germans | 100.0 /100 | #6 | Exceptional 98.4% |
| Inupiat | 100.0 /100 | #7 | Exceptional 98.4% |
| Slovenes | 100.0 /100 | #8 | Exceptional 98.3% |
| Swedes | 100.0 /100 | #9 | Exceptional 98.3% |
| English | 100.0 /100 | #10 | Exceptional 98.3% |
| Alaskan Athabascans | 100.0 /100 | #11 | Exceptional 98.3% |
| Carpatho Rusyns | 100.0 /100 | #12 | Exceptional 98.3% |
| Tlingit-Haida | 100.0 /100 | #13 | Exceptional 98.3% |
| Dutch | 100.0 /100 | #14 | Exceptional 98.3% |
| Scottish | 100.0 /100 | #15 | Exceptional 98.3% |
| Poles | 100.0 /100 | #16 | Exceptional 98.3% |
Demographics Similar to Immigrants from Lithuania by 5th Grade
In terms of 5th grade, the demographic groups most similar to Immigrants from Lithuania are Immigrants from India (97.8%, a difference of 0.0%), Icelander (97.8%, a difference of 0.0%), Ukrainian (97.8%, a difference of 0.010%), Immigrants from Netherlands (97.8%, a difference of 0.010%), and Immigrants from England (97.8%, a difference of 0.010%).
| Demographics | Rating | Rank | 5th Grade |
| Macedonians | 99.4 /100 | #72 | Exceptional 97.9% |
| Cherokee | 99.4 /100 | #73 | Exceptional 97.8% |
| Lumbee | 99.3 /100 | #74 | Exceptional 97.8% |
| Ukrainians | 99.3 /100 | #75 | Exceptional 97.8% |
| Immigrants | Netherlands | 99.3 /100 | #76 | Exceptional 97.8% |
| Immigrants | England | 99.3 /100 | #77 | Exceptional 97.8% |
| Osage | 99.3 /100 | #78 | Exceptional 97.8% |
| Immigrants | Lithuania | 99.2 /100 | #79 | Exceptional 97.8% |
| Immigrants | India | 99.2 /100 | #80 | Exceptional 97.8% |
| Icelanders | 99.2 /100 | #81 | Exceptional 97.8% |
| Pueblo | 99.2 /100 | #82 | Exceptional 97.8% |
| Zimbabweans | 99.0 /100 | #83 | Exceptional 97.8% |
| Potawatomi | 99.0 /100 | #84 | Exceptional 97.8% |
| Immigrants | Belgium | 99.0 /100 | #85 | Exceptional 97.8% |
| Cypriots | 98.9 /100 | #86 | Exceptional 97.8% |