English vs Costa Rican 10th Grade
COMPARE
English
Costa Rican
10th Grade
10th Grade Comparison
English
Costa Ricans
95.6%
10TH GRADE
100.0/ 100
METRIC RATING
13th/ 347
METRIC RANK
93.1%
10TH GRADE
4.2/ 100
METRIC RATING
239th/ 347
METRIC RANK
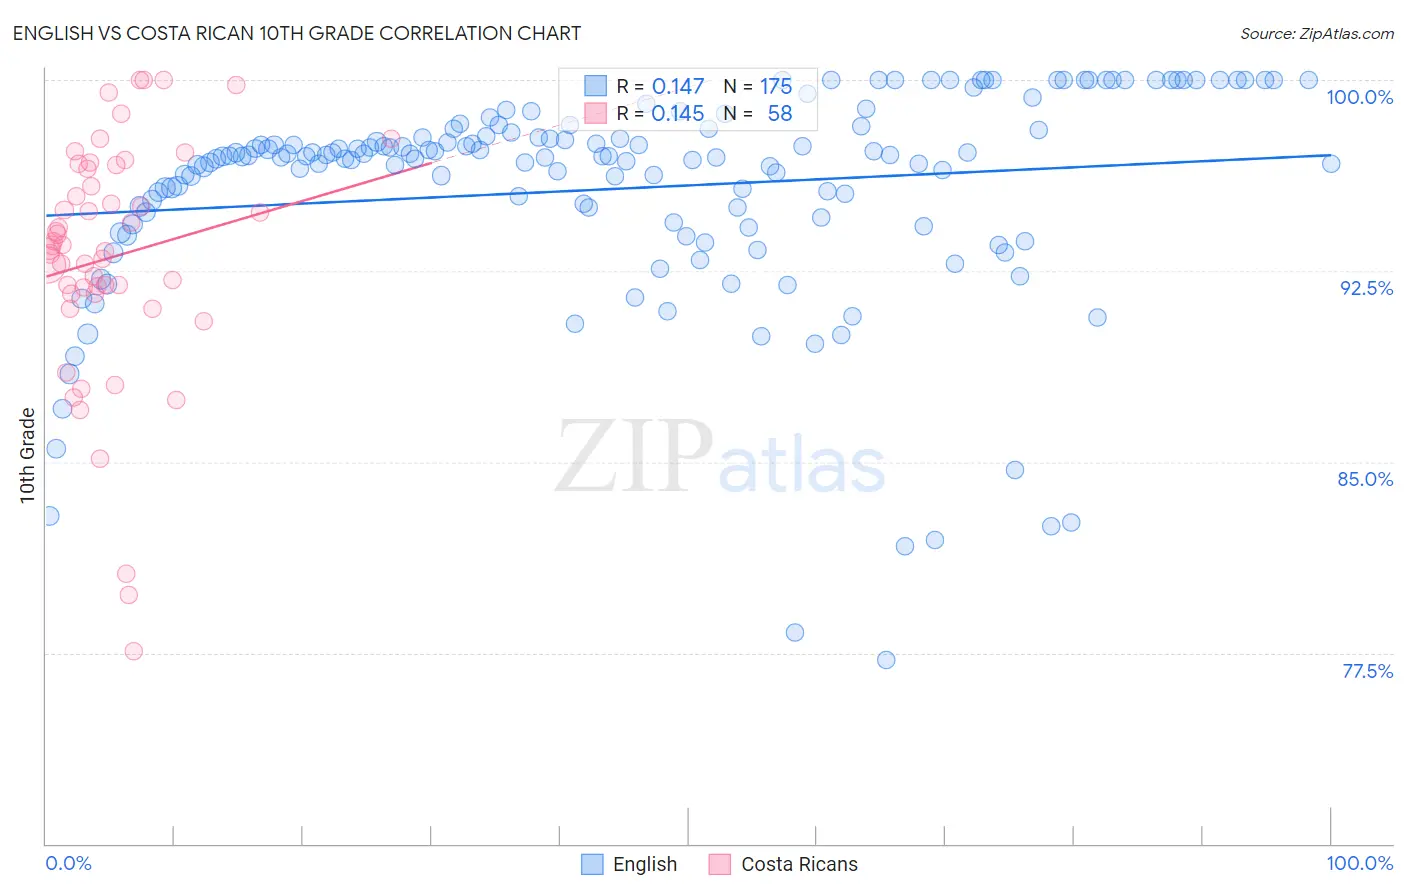
English vs Costa Rican 10th Grade Correlation Chart
The statistical analysis conducted on geographies consisting of 579,981,136 people shows a poor positive correlation between the proportion of English and percentage of population with at least 10th grade education in the United States with a correlation coefficient (R) of 0.147 and weighted average of 95.6%. Similarly, the statistical analysis conducted on geographies consisting of 253,601,730 people shows a poor positive correlation between the proportion of Costa Ricans and percentage of population with at least 10th grade education in the United States with a correlation coefficient (R) of 0.145 and weighted average of 93.1%, a difference of 2.7%.
10th Grade Correlation Summary
| Measurement | English | Costa Rican |
| Minimum | 77.2% | 77.5% |
| Maximum | 100.0% | 100.0% |
| Range | 22.8% | 22.5% |
| Mean | 95.7% | 93.0% |
| Median | 97.0% | 93.4% |
| Interquartile 25% (IQ1) | 94.4% | 91.6% |
| Interquartile 75% (IQ3) | 98.1% | 96.5% |
| Interquartile Range (IQR) | 3.7% | 4.9% |
| Standard Deviation (Sample) | 4.3% | 4.7% |
| Standard Deviation (Population) | 4.3% | 4.7% |
Similar Demographics by 10th Grade
Demographics Similar to English by 10th Grade
In terms of 10th grade, the demographic groups most similar to English are Tsimshian (95.6%, a difference of 0.010%), Irish (95.6%, a difference of 0.030%), Tlingit-Haida (95.7%, a difference of 0.040%), Scottish (95.6%, a difference of 0.040%), and Latvian (95.6%, a difference of 0.050%).
| Demographics | Rating | Rank | 10th Grade |
| Poles | 100.0 /100 | #6 | Exceptional 95.8% |
| Germans | 100.0 /100 | #7 | Exceptional 95.8% |
| Lithuanians | 100.0 /100 | #8 | Exceptional 95.8% |
| Finns | 100.0 /100 | #9 | Exceptional 95.8% |
| Croatians | 100.0 /100 | #10 | Exceptional 95.7% |
| Danes | 100.0 /100 | #11 | Exceptional 95.7% |
| Tlingit-Haida | 100.0 /100 | #12 | Exceptional 95.7% |
| English | 100.0 /100 | #13 | Exceptional 95.6% |
| Tsimshian | 100.0 /100 | #14 | Exceptional 95.6% |
| Irish | 100.0 /100 | #15 | Exceptional 95.6% |
| Scottish | 100.0 /100 | #16 | Exceptional 95.6% |
| Latvians | 100.0 /100 | #17 | Exceptional 95.6% |
| Italians | 100.0 /100 | #18 | Exceptional 95.6% |
| Scandinavians | 100.0 /100 | #19 | Exceptional 95.6% |
| Chinese | 100.0 /100 | #20 | Exceptional 95.5% |
Demographics Similar to Costa Ricans by 10th Grade
In terms of 10th grade, the demographic groups most similar to Costa Ricans are Nigerian (93.1%, a difference of 0.0%), Immigrants from Hong Kong (93.1%, a difference of 0.0%), Immigrants from Panama (93.1%, a difference of 0.010%), African (93.1%, a difference of 0.020%), and Afghan (93.1%, a difference of 0.020%).
| Demographics | Rating | Rank | 10th Grade |
| Bahamians | 4.9 /100 | #232 | Tragic 93.1% |
| Comanche | 4.9 /100 | #233 | Tragic 93.1% |
| Sub-Saharan Africans | 4.7 /100 | #234 | Tragic 93.1% |
| Africans | 4.6 /100 | #235 | Tragic 93.1% |
| Afghans | 4.5 /100 | #236 | Tragic 93.1% |
| Immigrants | Panama | 4.3 /100 | #237 | Tragic 93.1% |
| Nigerians | 4.2 /100 | #238 | Tragic 93.1% |
| Costa Ricans | 4.2 /100 | #239 | Tragic 93.1% |
| Immigrants | Hong Kong | 4.2 /100 | #240 | Tragic 93.1% |
| Immigrants | Somalia | 2.7 /100 | #241 | Tragic 93.0% |
| Immigrants | Cameroon | 2.6 /100 | #242 | Tragic 93.0% |
| Senegalese | 2.4 /100 | #243 | Tragic 93.0% |
| Spanish Americans | 2.1 /100 | #244 | Tragic 92.9% |
| Uruguayans | 1.8 /100 | #245 | Tragic 92.9% |
| Immigrants | Middle Africa | 1.7 /100 | #246 | Tragic 92.9% |