Arapaho vs Immigrants from Saudi Arabia 10th Grade
COMPARE
Arapaho
Immigrants from Saudi Arabia
10th Grade
10th Grade Comparison
Arapaho
Immigrants from Saudi Arabia
94.2%
10TH GRADE
90.5/ 100
METRIC RATING
137th/ 347
METRIC RANK
94.7%
10TH GRADE
99.0/ 100
METRIC RATING
87th/ 347
METRIC RANK
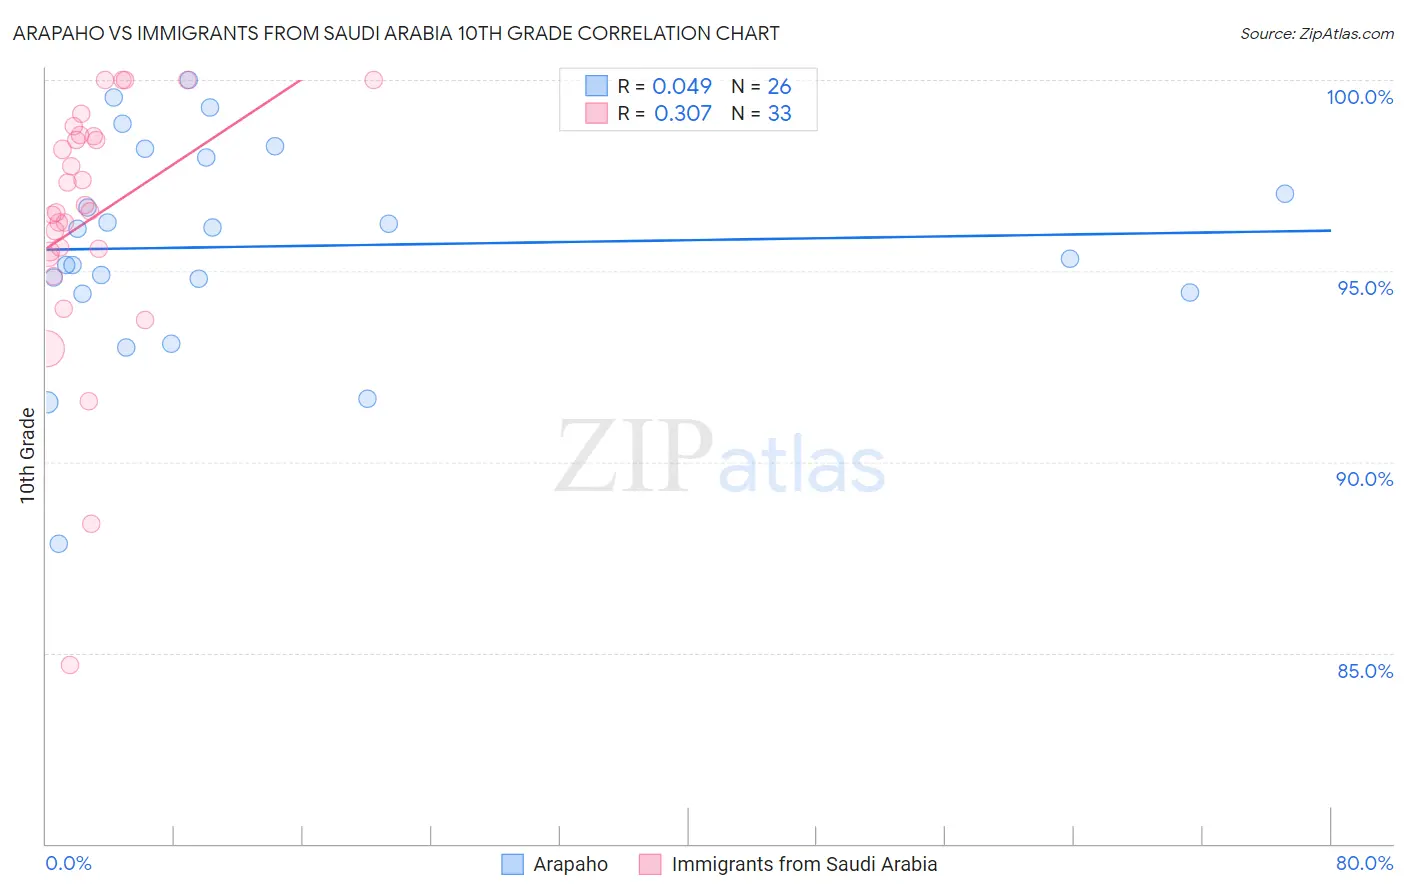
Arapaho vs Immigrants from Saudi Arabia 10th Grade Correlation Chart
The statistical analysis conducted on geographies consisting of 29,780,040 people shows no correlation between the proportion of Arapaho and percentage of population with at least 10th grade education in the United States with a correlation coefficient (R) of 0.049 and weighted average of 94.2%. Similarly, the statistical analysis conducted on geographies consisting of 164,277,573 people shows a mild positive correlation between the proportion of Immigrants from Saudi Arabia and percentage of population with at least 10th grade education in the United States with a correlation coefficient (R) of 0.307 and weighted average of 94.7%, a difference of 0.52%.
10th Grade Correlation Summary
| Measurement | Arapaho | Immigrants from Saudi Arabia |
| Minimum | 87.9% | 84.7% |
| Maximum | 100.0% | 100.0% |
| Range | 12.1% | 15.3% |
| Mean | 95.6% | 96.4% |
| Median | 95.7% | 96.6% |
| Interquartile 25% (IQ1) | 94.4% | 95.4% |
| Interquartile 75% (IQ3) | 98.0% | 98.5% |
| Interquartile Range (IQR) | 3.6% | 3.1% |
| Standard Deviation (Sample) | 2.8% | 3.3% |
| Standard Deviation (Population) | 2.7% | 3.3% |
Similar Demographics by 10th Grade
Demographics Similar to Arapaho by 10th Grade
In terms of 10th grade, the demographic groups most similar to Arapaho are Shoshone (94.2%, a difference of 0.010%), Immigrants from Sri Lanka (94.2%, a difference of 0.010%), Immigrants from Korea (94.2%, a difference of 0.020%), Osage (94.2%, a difference of 0.030%), and Immigrants from Bosnia and Herzegovina (94.2%, a difference of 0.030%).
| Demographics | Rating | Rank | 10th Grade |
| Immigrants | Greece | 92.7 /100 | #130 | Exceptional 94.3% |
| Immigrants | Eastern Europe | 92.5 /100 | #131 | Exceptional 94.3% |
| Immigrants | Russia | 92.4 /100 | #132 | Exceptional 94.3% |
| Creek | 91.9 /100 | #133 | Exceptional 94.2% |
| Osage | 91.7 /100 | #134 | Exceptional 94.2% |
| Immigrants | Korea | 91.3 /100 | #135 | Exceptional 94.2% |
| Shoshone | 90.8 /100 | #136 | Exceptional 94.2% |
| Arapaho | 90.5 /100 | #137 | Exceptional 94.2% |
| Immigrants | Sri Lanka | 89.9 /100 | #138 | Excellent 94.2% |
| Immigrants | Bosnia and Herzegovina | 89.4 /100 | #139 | Excellent 94.2% |
| Immigrants | Jordan | 87.6 /100 | #140 | Excellent 94.1% |
| Hmong | 86.6 /100 | #141 | Excellent 94.1% |
| Albanians | 86.5 /100 | #142 | Excellent 94.1% |
| Cherokee | 84.9 /100 | #143 | Excellent 94.1% |
| Immigrants | Kazakhstan | 84.9 /100 | #144 | Excellent 94.1% |
Demographics Similar to Immigrants from Saudi Arabia by 10th Grade
In terms of 10th grade, the demographic groups most similar to Immigrants from Saudi Arabia are Immigrants from Japan (94.7%, a difference of 0.0%), Crow (94.7%, a difference of 0.010%), Puget Sound Salish (94.7%, a difference of 0.010%), Immigrants from Western Europe (94.7%, a difference of 0.020%), and Icelander (94.7%, a difference of 0.020%).
| Demographics | Rating | Rank | 10th Grade |
| Immigrants | Denmark | 99.2 /100 | #80 | Exceptional 94.7% |
| Immigrants | Latvia | 99.2 /100 | #81 | Exceptional 94.7% |
| Swiss | 99.1 /100 | #82 | Exceptional 94.7% |
| Immigrants | Western Europe | 99.1 /100 | #83 | Exceptional 94.7% |
| Icelanders | 99.1 /100 | #84 | Exceptional 94.7% |
| Crow | 99.0 /100 | #85 | Exceptional 94.7% |
| Puget Sound Salish | 99.0 /100 | #86 | Exceptional 94.7% |
| Immigrants | Saudi Arabia | 99.0 /100 | #87 | Exceptional 94.7% |
| Immigrants | Japan | 99.0 /100 | #88 | Exceptional 94.7% |
| Immigrants | Moldova | 98.9 /100 | #89 | Exceptional 94.7% |
| South Africans | 98.8 /100 | #90 | Exceptional 94.7% |
| Whites/Caucasians | 98.8 /100 | #91 | Exceptional 94.7% |
| Yugoslavians | 98.4 /100 | #92 | Exceptional 94.6% |
| Soviet Union | 98.3 /100 | #93 | Exceptional 94.6% |
| Immigrants | Germany | 98.3 /100 | #94 | Exceptional 94.6% |