Basque vs Immigrants from India 3rd Grade
COMPARE
Basque
Immigrants from India
3rd Grade
3rd Grade Comparison
Basques
Immigrants from India
98.0%
3RD GRADE
96.5/ 100
METRIC RATING
111th/ 347
METRIC RANK
98.1%
3RD GRADE
98.8/ 100
METRIC RATING
88th/ 347
METRIC RANK
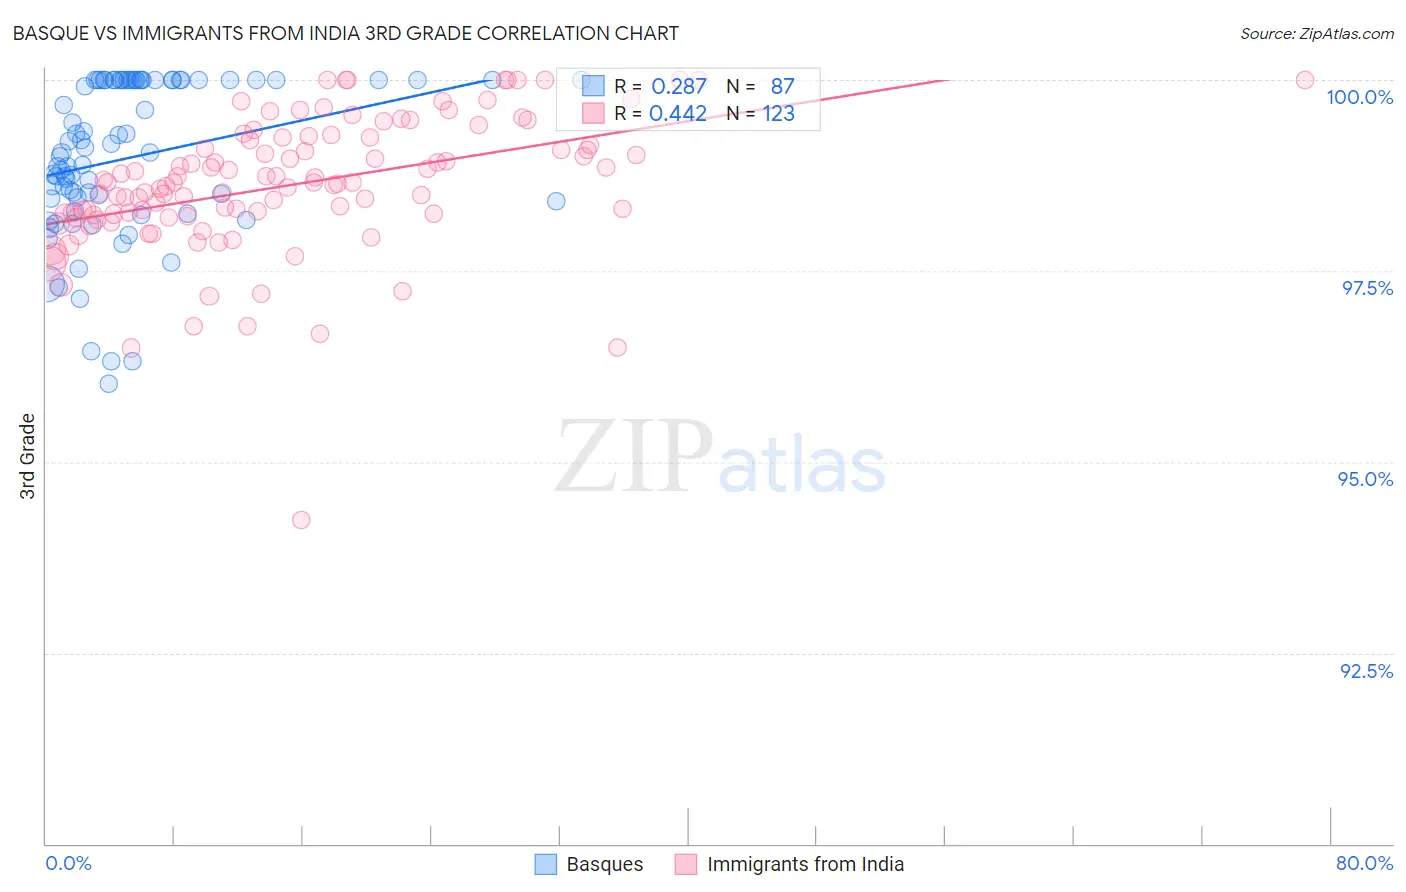
Basque vs Immigrants from India 3rd Grade Correlation Chart
The statistical analysis conducted on geographies consisting of 165,774,137 people shows a weak positive correlation between the proportion of Basques and percentage of population with at least 3rd grade education in the United States with a correlation coefficient (R) of 0.287 and weighted average of 98.0%. Similarly, the statistical analysis conducted on geographies consisting of 434,105,844 people shows a moderate positive correlation between the proportion of Immigrants from India and percentage of population with at least 3rd grade education in the United States with a correlation coefficient (R) of 0.442 and weighted average of 98.1%, a difference of 0.090%.
3rd Grade Correlation Summary
| Measurement | Basque | Immigrants from India |
| Minimum | 96.0% | 94.2% |
| Maximum | 100.0% | 100.0% |
| Range | 4.0% | 5.8% |
| Mean | 99.0% | 98.6% |
| Median | 99.1% | 98.7% |
| Interquartile 25% (IQ1) | 98.4% | 98.2% |
| Interquartile 75% (IQ3) | 100.0% | 99.2% |
| Interquartile Range (IQR) | 1.6% | 1.0% |
| Standard Deviation (Sample) | 1.0% | 0.89% |
| Standard Deviation (Population) | 1.0% | 0.89% |
Similar Demographics by 3rd Grade
Demographics Similar to Basques by 3rd Grade
In terms of 3rd grade, the demographic groups most similar to Basques are Immigrants from Switzerland (98.0%, a difference of 0.0%), Immigrants from Czechoslovakia (98.0%, a difference of 0.010%), Immigrants from Singapore (98.0%, a difference of 0.010%), Pima (98.0%, a difference of 0.010%), and Immigrants from Latvia (98.0%, a difference of 0.010%).
| Demographics | Rating | Rank | 3rd Grade |
| Turks | 97.6 /100 | #104 | Exceptional 98.1% |
| German Russians | 97.2 /100 | #105 | Exceptional 98.1% |
| Bhutanese | 97.2 /100 | #106 | Exceptional 98.1% |
| Immigrants | Czechoslovakia | 97.0 /100 | #107 | Exceptional 98.0% |
| Immigrants | Singapore | 96.7 /100 | #108 | Exceptional 98.0% |
| Pima | 96.7 /100 | #109 | Exceptional 98.0% |
| Immigrants | Switzerland | 96.6 /100 | #110 | Exceptional 98.0% |
| Basques | 96.5 /100 | #111 | Exceptional 98.0% |
| Immigrants | Latvia | 96.0 /100 | #112 | Exceptional 98.0% |
| Thais | 95.5 /100 | #113 | Exceptional 98.0% |
| Menominee | 95.4 /100 | #114 | Exceptional 98.0% |
| Okinawans | 95.2 /100 | #115 | Exceptional 98.0% |
| Immigrants | Norway | 95.2 /100 | #116 | Exceptional 98.0% |
| Immigrants | France | 95.1 /100 | #117 | Exceptional 98.0% |
| Iranians | 94.9 /100 | #118 | Exceptional 98.0% |
Demographics Similar to Immigrants from India by 3rd Grade
In terms of 3rd grade, the demographic groups most similar to Immigrants from India are Immigrants from Sweden (98.1%, a difference of 0.0%), Immigrants from Australia (98.1%, a difference of 0.0%), Potawatomi (98.1%, a difference of 0.0%), Immigrants from Denmark (98.1%, a difference of 0.0%), and Delaware (98.1%, a difference of 0.0%).
| Demographics | Rating | Rank | 3rd Grade |
| Icelanders | 99.1 /100 | #81 | Exceptional 98.1% |
| Shoshone | 99.0 /100 | #82 | Exceptional 98.1% |
| Ukrainians | 98.9 /100 | #83 | Exceptional 98.1% |
| Immigrants | Sweden | 98.9 /100 | #84 | Exceptional 98.1% |
| Immigrants | Australia | 98.9 /100 | #85 | Exceptional 98.1% |
| Potawatomi | 98.9 /100 | #86 | Exceptional 98.1% |
| Immigrants | Denmark | 98.8 /100 | #87 | Exceptional 98.1% |
| Immigrants | India | 98.8 /100 | #88 | Exceptional 98.1% |
| Delaware | 98.8 /100 | #89 | Exceptional 98.1% |
| Zimbabweans | 98.8 /100 | #90 | Exceptional 98.1% |
| Hopi | 98.7 /100 | #91 | Exceptional 98.1% |
| Immigrants | South Africa | 98.7 /100 | #92 | Exceptional 98.1% |
| Immigrants | Western Europe | 98.7 /100 | #93 | Exceptional 98.1% |
| Immigrants | Germany | 98.4 /100 | #94 | Exceptional 98.1% |
| Cypriots | 98.4 /100 | #95 | Exceptional 98.1% |