Immigrants from Poland vs Luxembourger 4th Grade
COMPARE
Immigrants from Poland
Luxembourger
4th Grade
4th Grade Comparison
Immigrants from Poland
Luxembourgers
97.5%
4TH GRADE
55.9/ 100
METRIC RATING
167th/ 347
METRIC RANK
98.2%
4TH GRADE
99.9/ 100
METRIC RATING
40th/ 347
METRIC RANK
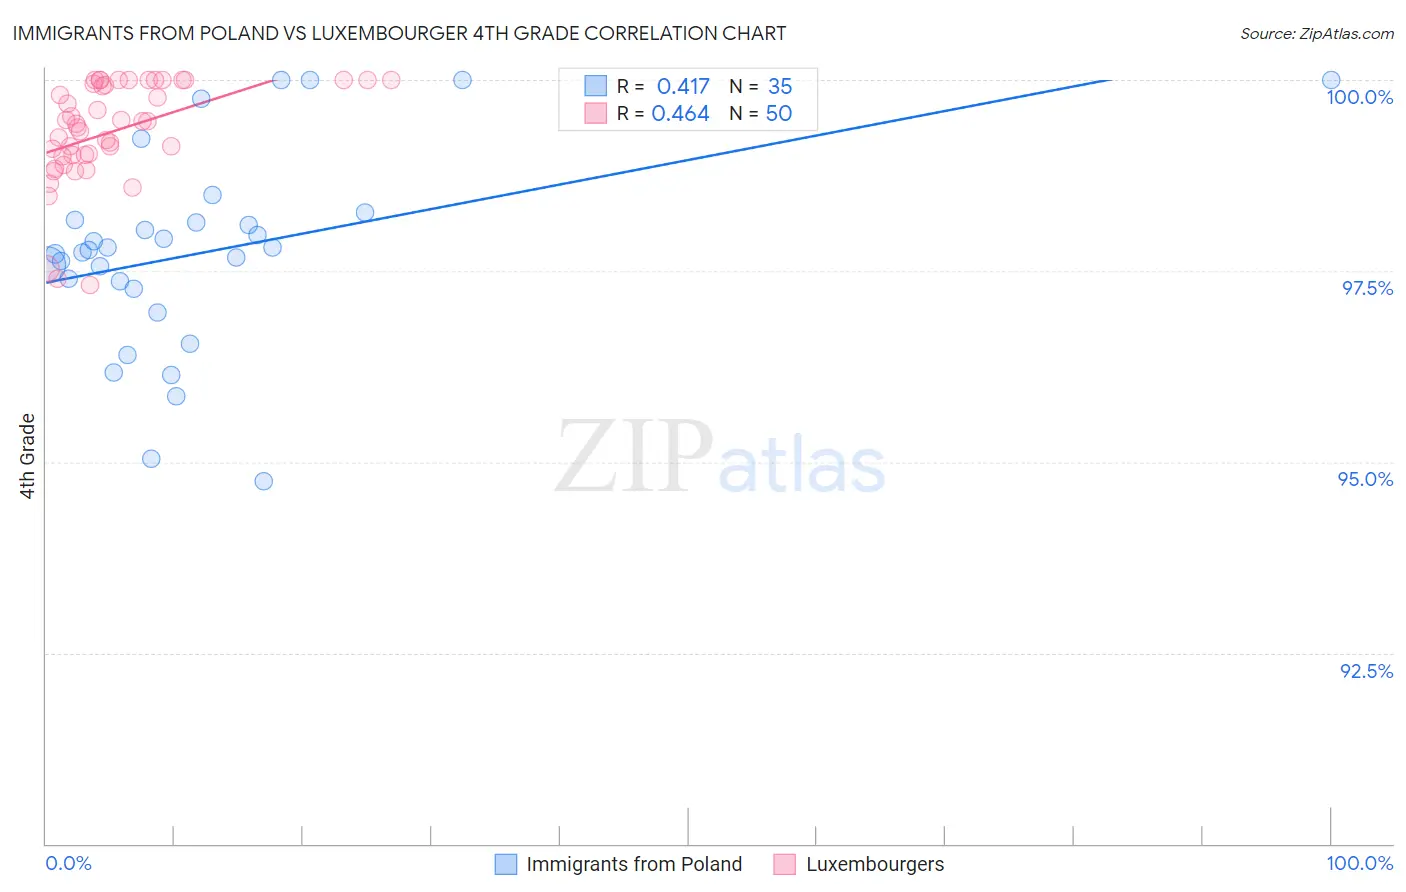
Immigrants from Poland vs Luxembourger 4th Grade Correlation Chart
The statistical analysis conducted on geographies consisting of 304,861,559 people shows a moderate positive correlation between the proportion of Immigrants from Poland and percentage of population with at least 4th grade education in the United States with a correlation coefficient (R) of 0.417 and weighted average of 97.5%. Similarly, the statistical analysis conducted on geographies consisting of 144,675,126 people shows a moderate positive correlation between the proportion of Luxembourgers and percentage of population with at least 4th grade education in the United States with a correlation coefficient (R) of 0.464 and weighted average of 98.2%, a difference of 0.67%.
4th Grade Correlation Summary
| Measurement | Immigrants from Poland | Luxembourger |
| Minimum | 94.8% | 97.3% |
| Maximum | 100.0% | 100.0% |
| Range | 5.2% | 2.7% |
| Mean | 97.7% | 99.3% |
| Median | 97.8% | 99.4% |
| Interquartile 25% (IQ1) | 97.3% | 99.0% |
| Interquartile 75% (IQ3) | 98.2% | 100.0% |
| Interquartile Range (IQR) | 0.90% | 0.99% |
| Standard Deviation (Sample) | 1.3% | 0.67% |
| Standard Deviation (Population) | 1.3% | 0.67% |
Similar Demographics by 4th Grade
Demographics Similar to Immigrants from Poland by 4th Grade
In terms of 4th grade, the demographic groups most similar to Immigrants from Poland are Kenyan (97.5%, a difference of 0.0%), Immigrants from Belarus (97.5%, a difference of 0.0%), Ugandan (97.6%, a difference of 0.010%), Venezuelan (97.6%, a difference of 0.010%), and Chilean (97.5%, a difference of 0.010%).
| Demographics | Rating | Rank | 4th Grade |
| Apache | 61.3 /100 | #160 | Good 97.6% |
| Marshallese | 60.8 /100 | #161 | Good 97.6% |
| Bermudans | 60.5 /100 | #162 | Good 97.6% |
| Immigrants | Iran | 60.3 /100 | #163 | Good 97.6% |
| Ugandans | 58.9 /100 | #164 | Average 97.6% |
| Venezuelans | 58.7 /100 | #165 | Average 97.6% |
| Kenyans | 56.5 /100 | #166 | Average 97.5% |
| Immigrants | Poland | 55.9 /100 | #167 | Average 97.5% |
| Immigrants | Belarus | 55.8 /100 | #168 | Average 97.5% |
| Chileans | 54.4 /100 | #169 | Average 97.5% |
| Immigrants | Spain | 51.8 /100 | #170 | Average 97.5% |
| Brazilians | 51.5 /100 | #171 | Average 97.5% |
| Immigrants | Sri Lanka | 51.1 /100 | #172 | Average 97.5% |
| Immigrants | Korea | 50.6 /100 | #173 | Average 97.5% |
| Egyptians | 50.0 /100 | #174 | Average 97.5% |
Demographics Similar to Luxembourgers by 4th Grade
In terms of 4th grade, the demographic groups most similar to Luxembourgers are Belgian (98.2%, a difference of 0.0%), Eastern European (98.2%, a difference of 0.0%), Latvian (98.2%, a difference of 0.010%), Aleut (98.2%, a difference of 0.010%), and British (98.2%, a difference of 0.030%).
| Demographics | Rating | Rank | 4th Grade |
| Swiss | 100.0 /100 | #33 | Exceptional 98.2% |
| Chippewa | 100.0 /100 | #34 | Exceptional 98.2% |
| Italians | 100.0 /100 | #35 | Exceptional 98.2% |
| British | 100.0 /100 | #36 | Exceptional 98.2% |
| Latvians | 99.9 /100 | #37 | Exceptional 98.2% |
| Aleuts | 99.9 /100 | #38 | Exceptional 98.2% |
| Belgians | 99.9 /100 | #39 | Exceptional 98.2% |
| Luxembourgers | 99.9 /100 | #40 | Exceptional 98.2% |
| Eastern Europeans | 99.9 /100 | #41 | Exceptional 98.2% |
| Hungarians | 99.9 /100 | #42 | Exceptional 98.2% |
| Northern Europeans | 99.9 /100 | #43 | Exceptional 98.2% |
| Native Hawaiians | 99.9 /100 | #44 | Exceptional 98.1% |
| Czechoslovakians | 99.9 /100 | #45 | Exceptional 98.1% |
| Ottawa | 99.9 /100 | #46 | Exceptional 98.1% |
| Arapaho | 99.9 /100 | #47 | Exceptional 98.1% |