Uruguayan vs Yakama 4th Grade
COMPARE
Uruguayan
Yakama
4th Grade
4th Grade Comparison
Uruguayans
Yakama
97.2%
4TH GRADE
3.5/ 100
METRIC RATING
230th/ 347
METRIC RANK
95.2%
4TH GRADE
0.0/ 100
METRIC RATING
340th/ 347
METRIC RANK
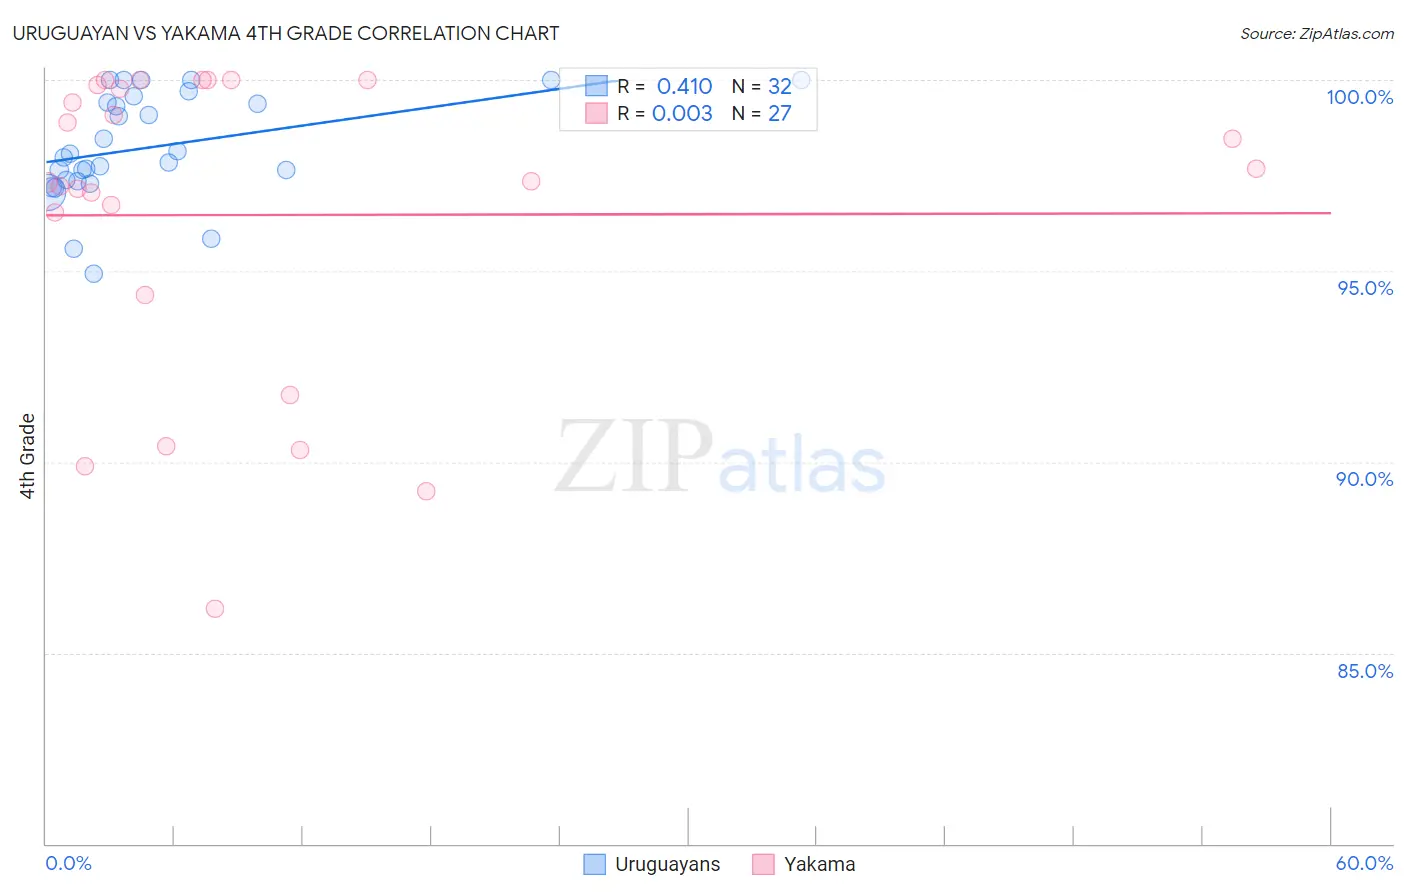
Uruguayan vs Yakama 4th Grade Correlation Chart
The statistical analysis conducted on geographies consisting of 144,782,794 people shows a moderate positive correlation between the proportion of Uruguayans and percentage of population with at least 4th grade education in the United States with a correlation coefficient (R) of 0.410 and weighted average of 97.2%. Similarly, the statistical analysis conducted on geographies consisting of 19,923,144 people shows no correlation between the proportion of Yakama and percentage of population with at least 4th grade education in the United States with a correlation coefficient (R) of 0.003 and weighted average of 95.2%, a difference of 2.1%.
4th Grade Correlation Summary
| Measurement | Uruguayan | Yakama |
| Minimum | 94.9% | 86.2% |
| Maximum | 100.0% | 100.0% |
| Range | 5.1% | 13.8% |
| Mean | 98.3% | 96.5% |
| Median | 98.0% | 97.3% |
| Interquartile 25% (IQ1) | 97.4% | 94.4% |
| Interquartile 75% (IQ3) | 99.5% | 99.9% |
| Interquartile Range (IQR) | 2.1% | 5.5% |
| Standard Deviation (Sample) | 1.4% | 4.1% |
| Standard Deviation (Population) | 1.4% | 4.0% |
Similar Demographics by 4th Grade
Demographics Similar to Uruguayans by 4th Grade
In terms of 4th grade, the demographic groups most similar to Uruguayans are Subsaharan African (97.2%, a difference of 0.0%), Liberian (97.2%, a difference of 0.0%), Immigrants from Malaysia (97.2%, a difference of 0.0%), Immigrants from Western Asia (97.2%, a difference of 0.0%), and Bahamian (97.2%, a difference of 0.010%).
| Demographics | Rating | Rank | 4th Grade |
| Immigrants | Sudan | 5.0 /100 | #223 | Tragic 97.2% |
| Immigrants | Syria | 5.0 /100 | #224 | Tragic 97.2% |
| Immigrants | Iraq | 4.6 /100 | #225 | Tragic 97.2% |
| Bahamians | 3.8 /100 | #226 | Tragic 97.2% |
| Immigrants | Pakistan | 3.7 /100 | #227 | Tragic 97.2% |
| Sub-Saharan Africans | 3.6 /100 | #228 | Tragic 97.2% |
| Liberians | 3.6 /100 | #229 | Tragic 97.2% |
| Uruguayans | 3.5 /100 | #230 | Tragic 97.2% |
| Immigrants | Malaysia | 3.4 /100 | #231 | Tragic 97.2% |
| Immigrants | Western Asia | 3.4 /100 | #232 | Tragic 97.2% |
| Senegalese | 3.1 /100 | #233 | Tragic 97.2% |
| Assyrians/Chaldeans/Syriacs | 3.0 /100 | #234 | Tragic 97.2% |
| Yuman | 2.9 /100 | #235 | Tragic 97.2% |
| Immigrants | Eastern Asia | 2.7 /100 | #236 | Tragic 97.2% |
| Immigrants | Costa Rica | 2.0 /100 | #237 | Tragic 97.2% |
Demographics Similar to Yakama by 4th Grade
In terms of 4th grade, the demographic groups most similar to Yakama are Immigrants from Yemen (95.2%, a difference of 0.010%), Guatemalan (95.3%, a difference of 0.090%), Immigrants from Central America (95.1%, a difference of 0.090%), Immigrants from Guatemala (95.1%, a difference of 0.12%), and Immigrants from Mexico (95.1%, a difference of 0.15%).
| Demographics | Rating | Rank | 4th Grade |
| Immigrants | Dominican Republic | 0.0 /100 | #333 | Tragic 95.7% |
| Immigrants | Cabo Verde | 0.0 /100 | #334 | Tragic 95.7% |
| Immigrants | Latin America | 0.0 /100 | #335 | Tragic 95.7% |
| Mexicans | 0.0 /100 | #336 | Tragic 95.6% |
| Central Americans | 0.0 /100 | #337 | Tragic 95.5% |
| Nepalese | 0.0 /100 | #338 | Tragic 95.5% |
| Guatemalans | 0.0 /100 | #339 | Tragic 95.3% |
| Yakama | 0.0 /100 | #340 | Tragic 95.2% |
| Immigrants | Yemen | 0.0 /100 | #341 | Tragic 95.2% |
| Immigrants | Central America | 0.0 /100 | #342 | Tragic 95.1% |
| Immigrants | Guatemala | 0.0 /100 | #343 | Tragic 95.1% |
| Immigrants | Mexico | 0.0 /100 | #344 | Tragic 95.1% |
| Salvadorans | 0.0 /100 | #345 | Tragic 95.0% |
| Immigrants | El Salvador | 0.0 /100 | #346 | Tragic 94.8% |
| Spanish American Indians | 0.0 /100 | #347 | Tragic 94.6% |