Barbadian vs Immigrants from Ecuador Child Poverty Under the Age of 16
COMPARE
Barbadian
Immigrants from Ecuador
Child Poverty Under the Age of 16
Child Poverty Under the Age of 16 Comparison
Barbadians
Immigrants from Ecuador
20.0%
CHILD POVERTY UNDER THE AGE OF 16
0.0/ 100
METRIC RATING
282nd/ 347
METRIC RANK
19.4%
CHILD POVERTY UNDER THE AGE OF 16
0.1/ 100
METRIC RATING
264th/ 347
METRIC RANK
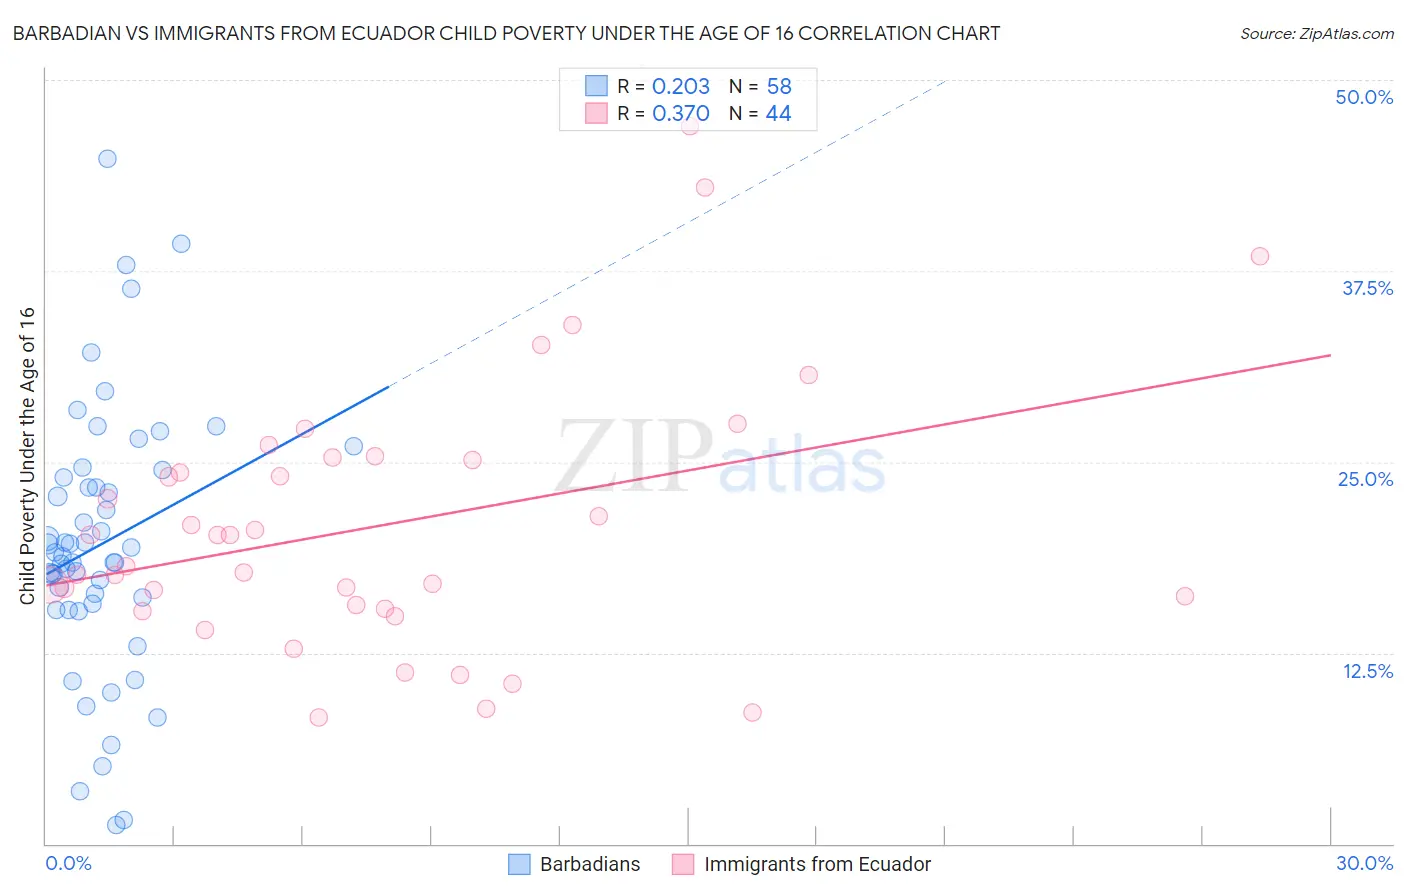
Barbadian vs Immigrants from Ecuador Child Poverty Under the Age of 16 Correlation Chart
The statistical analysis conducted on geographies consisting of 140,893,894 people shows a weak positive correlation between the proportion of Barbadians and poverty level among children under the age of 16 in the United States with a correlation coefficient (R) of 0.203 and weighted average of 20.0%. Similarly, the statistical analysis conducted on geographies consisting of 269,497,524 people shows a mild positive correlation between the proportion of Immigrants from Ecuador and poverty level among children under the age of 16 in the United States with a correlation coefficient (R) of 0.370 and weighted average of 19.4%, a difference of 3.1%.
Child Poverty Under the Age of 16 Correlation Summary
| Measurement | Barbadian | Immigrants from Ecuador |
| Minimum | 1.2% | 8.3% |
| Maximum | 44.9% | 47.0% |
| Range | 43.6% | 38.7% |
| Mean | 19.6% | 20.9% |
| Median | 18.9% | 19.2% |
| Interquartile 25% (IQ1) | 15.7% | 15.5% |
| Interquartile 75% (IQ3) | 24.0% | 25.2% |
| Interquartile Range (IQR) | 8.3% | 9.7% |
| Standard Deviation (Sample) | 8.7% | 8.7% |
| Standard Deviation (Population) | 8.7% | 8.6% |
Demographics Similar to Barbadians and Immigrants from Ecuador by Child Poverty Under the Age of 16
In terms of child poverty under the age of 16, the demographic groups most similar to Barbadians are Central American (20.0%, a difference of 0.030%), Immigrants from Zaire (20.1%, a difference of 0.23%), Subsaharan African (19.9%, a difference of 0.75%), Comanche (19.9%, a difference of 0.75%), and Bangladeshi (19.9%, a difference of 0.76%). Similarly, the demographic groups most similar to Immigrants from Ecuador are Vietnamese (19.4%, a difference of 0.060%), Chickasaw (19.5%, a difference of 0.12%), Liberian (19.5%, a difference of 0.22%), Cherokee (19.5%, a difference of 0.51%), and Jamaican (19.7%, a difference of 1.2%).
| Demographics | Rating | Rank | Child Poverty Under the Age of 16 |
| Vietnamese | 0.1 /100 | #263 | Tragic 19.4% |
| Immigrants | Ecuador | 0.1 /100 | #264 | Tragic 19.4% |
| Chickasaw | 0.1 /100 | #265 | Tragic 19.5% |
| Liberians | 0.1 /100 | #266 | Tragic 19.5% |
| Cherokee | 0.1 /100 | #267 | Tragic 19.5% |
| Jamaicans | 0.1 /100 | #268 | Tragic 19.7% |
| Immigrants | El Salvador | 0.1 /100 | #269 | Tragic 19.7% |
| Spanish American Indians | 0.1 /100 | #270 | Tragic 19.7% |
| Immigrants | Liberia | 0.1 /100 | #271 | Tragic 19.7% |
| Immigrants | Bangladesh | 0.1 /100 | #272 | Tragic 19.8% |
| Immigrants | Jamaica | 0.1 /100 | #273 | Tragic 19.8% |
| Immigrants | Cabo Verde | 0.1 /100 | #274 | Tragic 19.9% |
| Immigrants | Barbados | 0.1 /100 | #275 | Tragic 19.9% |
| Belizeans | 0.1 /100 | #276 | Tragic 19.9% |
| Iroquois | 0.1 /100 | #277 | Tragic 19.9% |
| Bangladeshis | 0.0 /100 | #278 | Tragic 19.9% |
| Sub-Saharan Africans | 0.0 /100 | #279 | Tragic 19.9% |
| Comanche | 0.0 /100 | #280 | Tragic 19.9% |
| Central Americans | 0.0 /100 | #281 | Tragic 20.0% |
| Barbadians | 0.0 /100 | #282 | Tragic 20.0% |
| Immigrants | Zaire | 0.0 /100 | #283 | Tragic 20.1% |