Bangladeshi vs Hawaiian 11th Grade
COMPARE
Bangladeshi
Hawaiian
11th Grade
11th Grade Comparison
Bangladeshis
Hawaiians
90.9%
11TH GRADE
0.1/ 100
METRIC RATING
276th/ 347
METRIC RANK
92.3%
11TH GRADE
25.5/ 100
METRIC RATING
198th/ 347
METRIC RANK
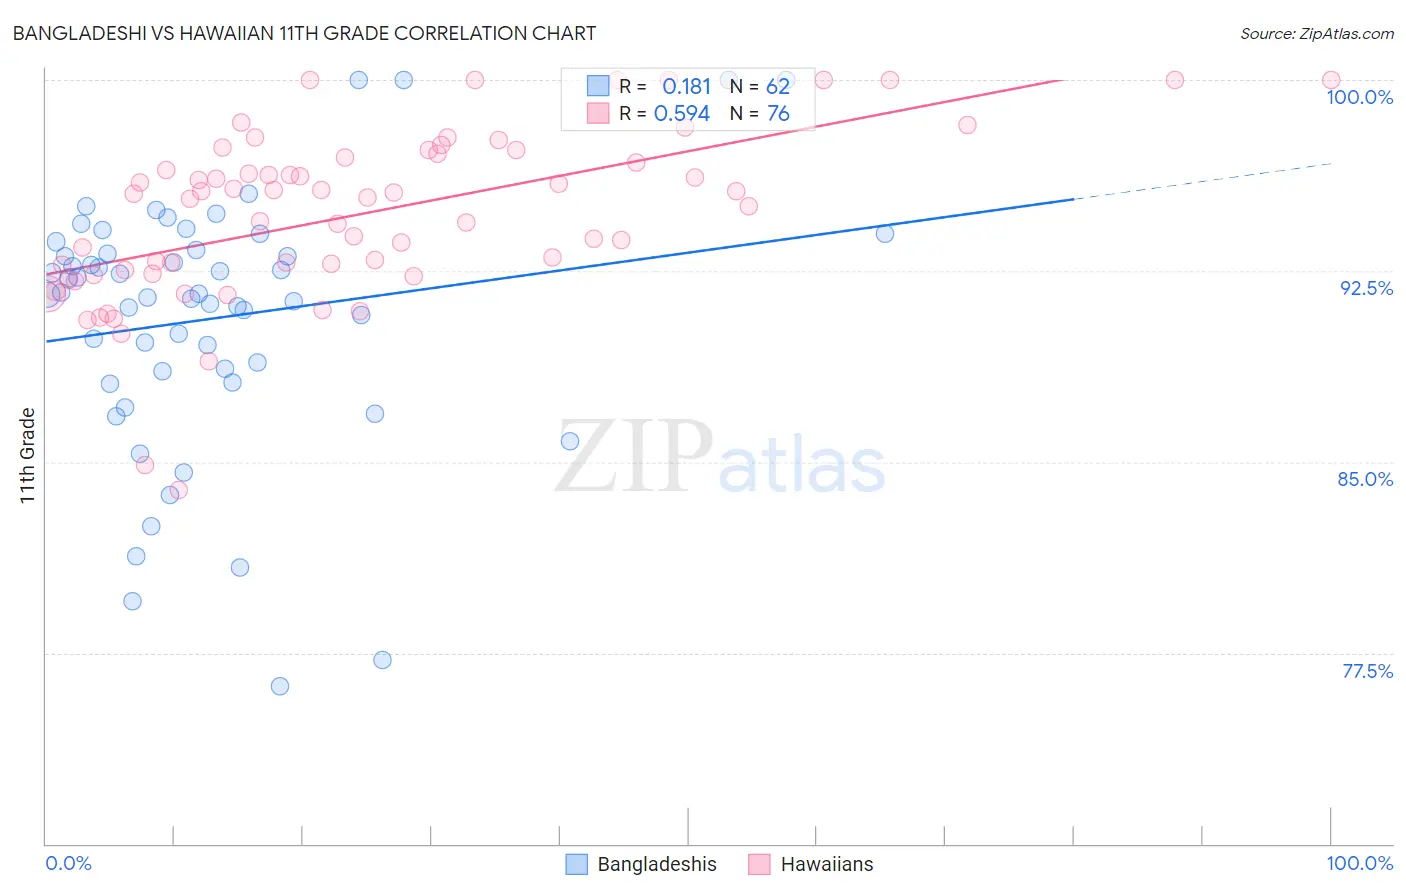
Bangladeshi vs Hawaiian 11th Grade Correlation Chart
The statistical analysis conducted on geographies consisting of 141,450,108 people shows a poor positive correlation between the proportion of Bangladeshis and percentage of population with at least 11th grade education in the United States with a correlation coefficient (R) of 0.181 and weighted average of 90.9%. Similarly, the statistical analysis conducted on geographies consisting of 327,620,881 people shows a substantial positive correlation between the proportion of Hawaiians and percentage of population with at least 11th grade education in the United States with a correlation coefficient (R) of 0.594 and weighted average of 92.3%, a difference of 1.5%.
11th Grade Correlation Summary
| Measurement | Bangladeshi | Hawaiian |
| Minimum | 76.2% | 83.9% |
| Maximum | 100.0% | 100.0% |
| Range | 23.8% | 16.1% |
| Mean | 90.6% | 94.7% |
| Median | 91.6% | 95.5% |
| Interquartile 25% (IQ1) | 88.5% | 92.5% |
| Interquartile 75% (IQ3) | 93.3% | 97.0% |
| Interquartile Range (IQR) | 4.8% | 4.6% |
| Standard Deviation (Sample) | 5.0% | 3.3% |
| Standard Deviation (Population) | 5.0% | 3.3% |
Similar Demographics by 11th Grade
Demographics Similar to Bangladeshis by 11th Grade
In terms of 11th grade, the demographic groups most similar to Bangladeshis are Immigrants from Congo (90.9%, a difference of 0.020%), Malaysian (90.8%, a difference of 0.050%), Immigrants from South Eastern Asia (90.9%, a difference of 0.070%), Immigrants from Trinidad and Tobago (90.9%, a difference of 0.080%), and Barbadian (90.8%, a difference of 0.10%).
| Demographics | Rating | Rank | 11th Grade |
| Ute | 0.2 /100 | #269 | Tragic 91.1% |
| Trinidadians and Tobagonians | 0.2 /100 | #270 | Tragic 91.1% |
| Immigrants | Peru | 0.1 /100 | #271 | Tragic 91.0% |
| West Indians | 0.1 /100 | #272 | Tragic 91.0% |
| Paiute | 0.1 /100 | #273 | Tragic 91.0% |
| Immigrants | Trinidad and Tobago | 0.1 /100 | #274 | Tragic 90.9% |
| Immigrants | South Eastern Asia | 0.1 /100 | #275 | Tragic 90.9% |
| Bangladeshis | 0.1 /100 | #276 | Tragic 90.9% |
| Immigrants | Congo | 0.1 /100 | #277 | Tragic 90.9% |
| Malaysians | 0.1 /100 | #278 | Tragic 90.8% |
| Barbadians | 0.0 /100 | #279 | Tragic 90.8% |
| Sri Lankans | 0.0 /100 | #280 | Tragic 90.7% |
| Dutch West Indians | 0.0 /100 | #281 | Tragic 90.7% |
| Immigrants | St. Vincent and the Grenadines | 0.0 /100 | #282 | Tragic 90.7% |
| Immigrants | Barbados | 0.0 /100 | #283 | Tragic 90.7% |
Demographics Similar to Hawaiians by 11th Grade
In terms of 11th grade, the demographic groups most similar to Hawaiians are Immigrants from Uganda (92.3%, a difference of 0.0%), Panamanian (92.3%, a difference of 0.010%), Marshallese (92.3%, a difference of 0.010%), Samoan (92.3%, a difference of 0.010%), and Immigrants from China (92.3%, a difference of 0.010%).
| Demographics | Rating | Rank | 11th Grade |
| French American Indians | 30.8 /100 | #191 | Fair 92.3% |
| Immigrants | Syria | 30.4 /100 | #192 | Fair 92.3% |
| Moroccans | 28.7 /100 | #193 | Fair 92.3% |
| Sioux | 28.5 /100 | #194 | Fair 92.3% |
| Liberians | 26.8 /100 | #195 | Fair 92.3% |
| Panamanians | 26.4 /100 | #196 | Fair 92.3% |
| Marshallese | 26.0 /100 | #197 | Fair 92.3% |
| Hawaiians | 25.5 /100 | #198 | Fair 92.3% |
| Immigrants | Uganda | 25.2 /100 | #199 | Fair 92.3% |
| Samoans | 25.1 /100 | #200 | Fair 92.3% |
| Immigrants | China | 25.1 /100 | #201 | Fair 92.3% |
| Immigrants | Eastern Africa | 24.1 /100 | #202 | Fair 92.3% |
| Immigrants | Sudan | 23.5 /100 | #203 | Fair 92.3% |
| Immigrants | Hong Kong | 23.3 /100 | #204 | Fair 92.2% |
| Kiowa | 23.2 /100 | #205 | Fair 92.2% |