Immigrants from Kazakhstan vs Filipino 11th Grade
COMPARE
Immigrants from Kazakhstan
Filipino
11th Grade
11th Grade Comparison
Immigrants from Kazakhstan
Filipinos
93.1%
11TH GRADE
92.4/ 100
METRIC RATING
127th/ 347
METRIC RANK
94.1%
11TH GRADE
99.9/ 100
METRIC RATING
47th/ 347
METRIC RANK
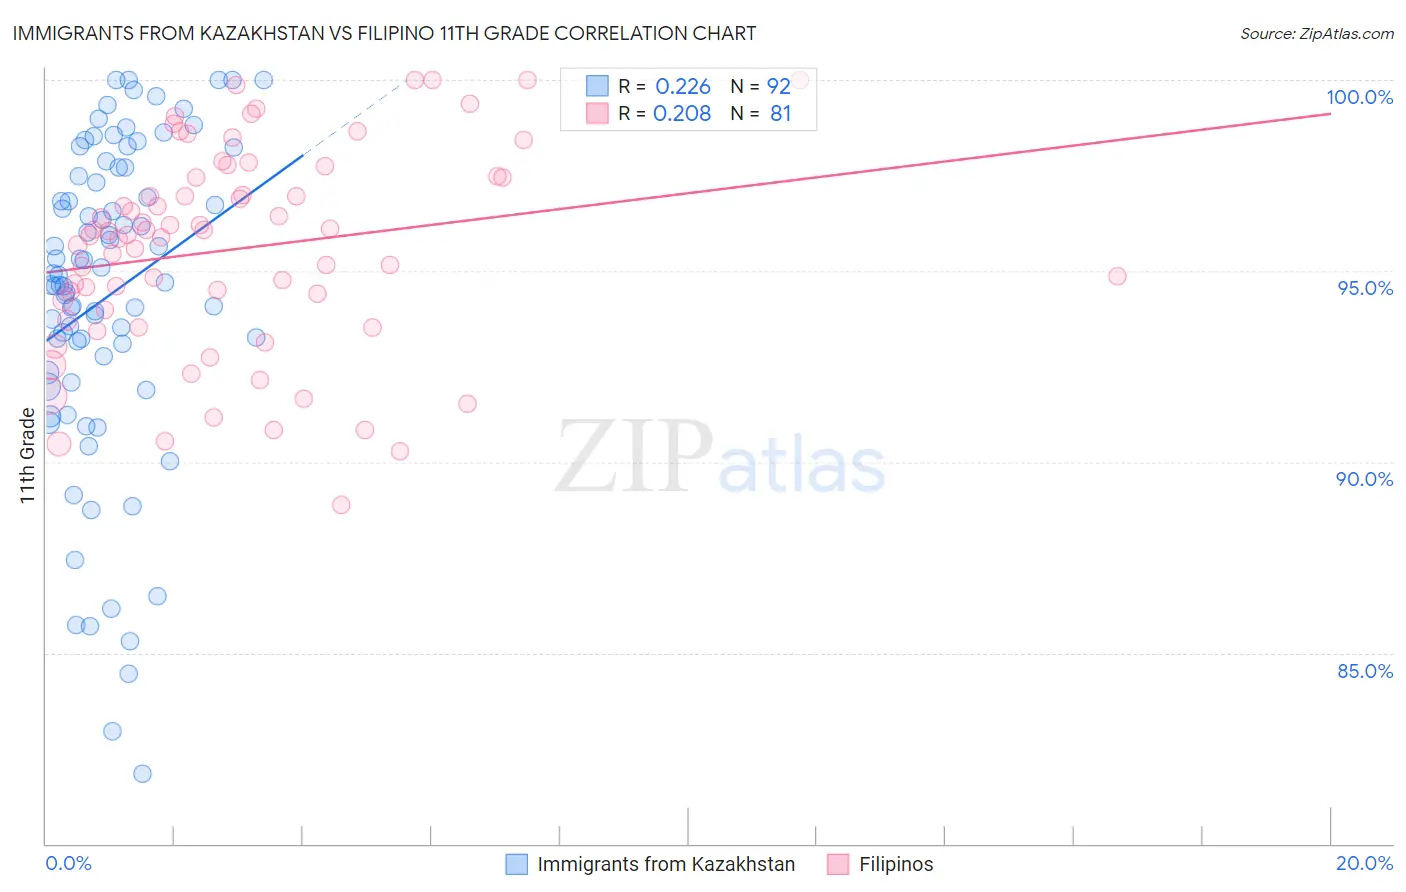
Immigrants from Kazakhstan vs Filipino 11th Grade Correlation Chart
The statistical analysis conducted on geographies consisting of 124,444,172 people shows a weak positive correlation between the proportion of Immigrants from Kazakhstan and percentage of population with at least 11th grade education in the United States with a correlation coefficient (R) of 0.226 and weighted average of 93.1%. Similarly, the statistical analysis conducted on geographies consisting of 254,351,912 people shows a weak positive correlation between the proportion of Filipinos and percentage of population with at least 11th grade education in the United States with a correlation coefficient (R) of 0.208 and weighted average of 94.1%, a difference of 1.1%.
11th Grade Correlation Summary
| Measurement | Immigrants from Kazakhstan | Filipino |
| Minimum | 81.8% | 88.9% |
| Maximum | 100.0% | 100.0% |
| Range | 18.2% | 11.1% |
| Mean | 94.4% | 95.6% |
| Median | 94.8% | 95.9% |
| Interquartile 25% (IQ1) | 92.6% | 93.8% |
| Interquartile 75% (IQ3) | 97.6% | 97.5% |
| Interquartile Range (IQR) | 5.0% | 3.6% |
| Standard Deviation (Sample) | 4.2% | 2.7% |
| Standard Deviation (Population) | 4.1% | 2.7% |
Similar Demographics by 11th Grade
Demographics Similar to Immigrants from Kazakhstan by 11th Grade
In terms of 11th grade, the demographic groups most similar to Immigrants from Kazakhstan are Immigrants from Jordan (93.1%, a difference of 0.0%), Immigrants from Ukraine (93.0%, a difference of 0.080%), Albanian (93.0%, a difference of 0.090%), Egyptian (93.0%, a difference of 0.090%), and Immigrants from Bosnia and Herzegovina (93.0%, a difference of 0.10%).
| Demographics | Rating | Rank | 11th Grade |
| Immigrants | Russia | 96.6 /100 | #120 | Exceptional 93.3% |
| German Russians | 96.4 /100 | #121 | Exceptional 93.3% |
| Immigrants | Belarus | 96.3 /100 | #122 | Exceptional 93.3% |
| Immigrants | Greece | 95.9 /100 | #123 | Exceptional 93.2% |
| Immigrants | Eastern Europe | 95.9 /100 | #124 | Exceptional 93.2% |
| Immigrants | Sri Lanka | 95.6 /100 | #125 | Exceptional 93.2% |
| Basques | 95.2 /100 | #126 | Exceptional 93.2% |
| Immigrants | Kazakhstan | 92.4 /100 | #127 | Exceptional 93.1% |
| Immigrants | Jordan | 92.4 /100 | #128 | Exceptional 93.1% |
| Immigrants | Ukraine | 89.8 /100 | #129 | Excellent 93.0% |
| Albanians | 89.5 /100 | #130 | Excellent 93.0% |
| Egyptians | 89.5 /100 | #131 | Excellent 93.0% |
| Immigrants | Bosnia and Herzegovina | 89.0 /100 | #132 | Excellent 93.0% |
| Mongolians | 87.6 /100 | #133 | Excellent 93.0% |
| Delaware | 87.3 /100 | #134 | Excellent 93.0% |
Demographics Similar to Filipinos by 11th Grade
In terms of 11th grade, the demographic groups most similar to Filipinos are Macedonian (94.1%, a difference of 0.0%), Slavic (94.1%, a difference of 0.0%), Serbian (94.1%, a difference of 0.010%), French (94.1%, a difference of 0.010%), and Australian (94.1%, a difference of 0.020%).
| Demographics | Rating | Rank | 11th Grade |
| Thais | 99.9 /100 | #40 | Exceptional 94.1% |
| Cypriots | 99.9 /100 | #41 | Exceptional 94.1% |
| Immigrants | Austria | 99.9 /100 | #42 | Exceptional 94.1% |
| Greeks | 99.9 /100 | #43 | Exceptional 94.1% |
| Immigrants | Ireland | 99.9 /100 | #44 | Exceptional 94.1% |
| Australians | 99.9 /100 | #45 | Exceptional 94.1% |
| Serbians | 99.9 /100 | #46 | Exceptional 94.1% |
| Filipinos | 99.9 /100 | #47 | Exceptional 94.1% |
| Macedonians | 99.9 /100 | #48 | Exceptional 94.1% |
| Slavs | 99.9 /100 | #49 | Exceptional 94.1% |
| French | 99.9 /100 | #50 | Exceptional 94.1% |
| Turks | 99.9 /100 | #51 | Exceptional 94.0% |
| Immigrants | Canada | 99.9 /100 | #52 | Exceptional 94.0% |
| Immigrants | Australia | 99.9 /100 | #53 | Exceptional 94.0% |
| Immigrants | North America | 99.9 /100 | #54 | Exceptional 94.0% |