Immigrants from Netherlands vs Croatian No Schooling Completed
COMPARE
Immigrants from Netherlands
Croatian
No Schooling Completed
No Schooling Completed Comparison
Immigrants from Netherlands
Croatians
1.7%
NO SCHOOLING COMPLETED
99.6/ 100
METRIC RATING
70th/ 347
METRIC RANK
1.5%
NO SCHOOLING COMPLETED
100.0/ 100
METRIC RATING
17th/ 347
METRIC RANK
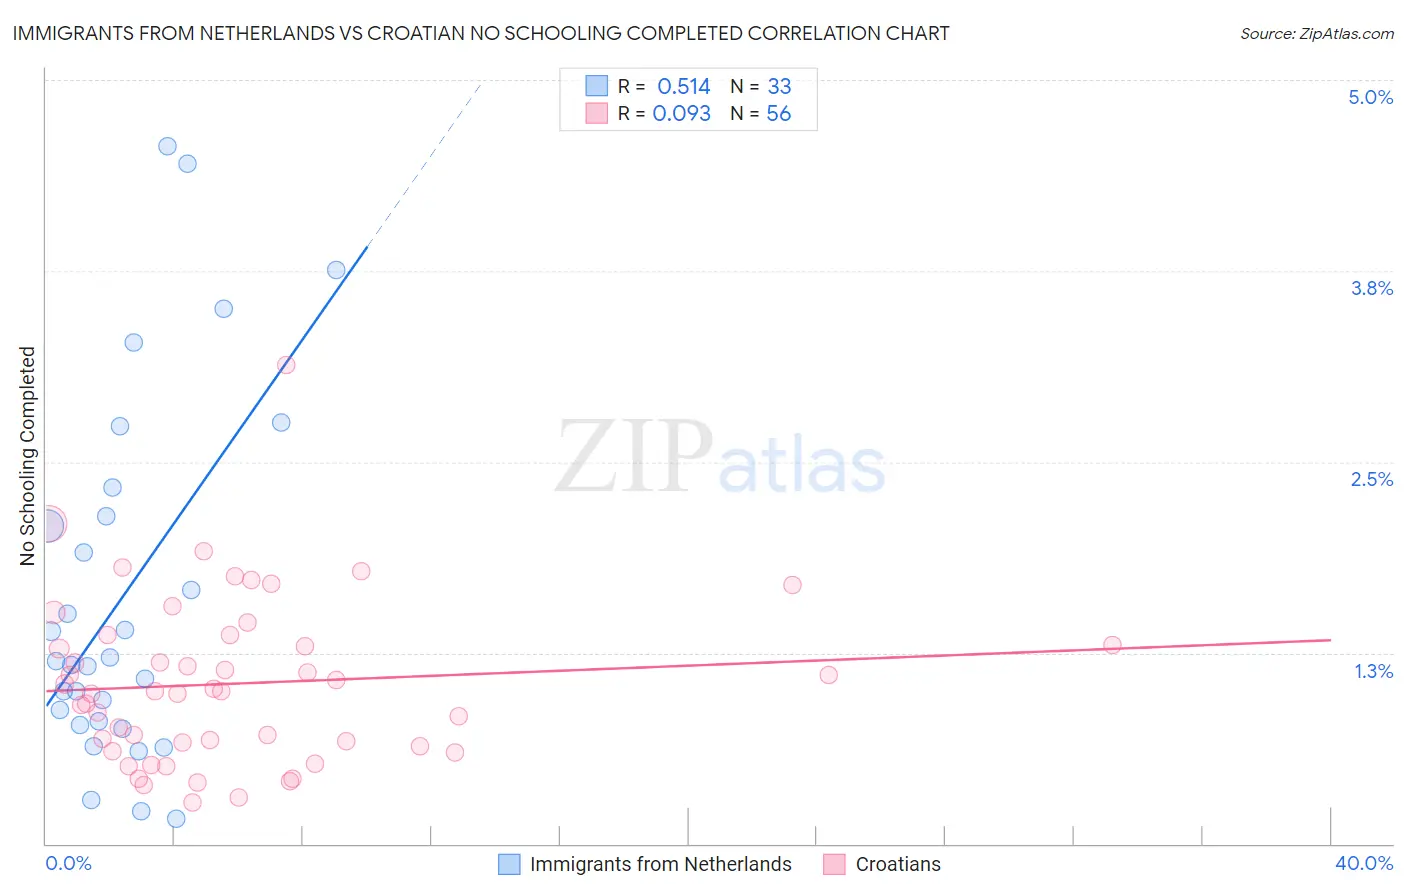
Immigrants from Netherlands vs Croatian No Schooling Completed Correlation Chart
The statistical analysis conducted on geographies consisting of 236,079,669 people shows a substantial positive correlation between the proportion of Immigrants from Netherlands and percentage of population with no schooling in the United States with a correlation coefficient (R) of 0.514 and weighted average of 1.7%. Similarly, the statistical analysis conducted on geographies consisting of 370,650,548 people shows a slight positive correlation between the proportion of Croatians and percentage of population with no schooling in the United States with a correlation coefficient (R) of 0.093 and weighted average of 1.5%, a difference of 17.2%.
No Schooling Completed Correlation Summary
| Measurement | Immigrants from Netherlands | Croatian |
| Minimum | 0.16% | 0.27% |
| Maximum | 4.6% | 3.1% |
| Range | 4.4% | 2.9% |
| Mean | 1.6% | 1.0% |
| Median | 1.2% | 1.0% |
| Interquartile 25% (IQ1) | 0.79% | 0.65% |
| Interquartile 75% (IQ3) | 2.2% | 1.3% |
| Interquartile Range (IQR) | 1.4% | 0.68% |
| Standard Deviation (Sample) | 1.2% | 0.54% |
| Standard Deviation (Population) | 1.2% | 0.54% |
Similar Demographics by No Schooling Completed
Demographics Similar to Immigrants from Netherlands by No Schooling Completed
In terms of no schooling completed, the demographic groups most similar to Immigrants from Netherlands are Immigrants from England (1.7%, a difference of 0.34%), Cajun (1.7%, a difference of 0.51%), Chickasaw (1.7%, a difference of 0.97%), Immigrants from India (1.7%, a difference of 1.0%), and Zimbabwean (1.7%, a difference of 1.0%).
| Demographics | Rating | Rank | No Schooling Completed |
| Russians | 99.8 /100 | #63 | Exceptional 1.7% |
| New Zealanders | 99.7 /100 | #64 | Exceptional 1.7% |
| Serbians | 99.7 /100 | #65 | Exceptional 1.7% |
| Canadians | 99.7 /100 | #66 | Exceptional 1.7% |
| Immigrants | Austria | 99.7 /100 | #67 | Exceptional 1.7% |
| Immigrants | Lithuania | 99.7 /100 | #68 | Exceptional 1.7% |
| Chickasaw | 99.6 /100 | #69 | Exceptional 1.7% |
| Immigrants | Netherlands | 99.6 /100 | #70 | Exceptional 1.7% |
| Immigrants | England | 99.5 /100 | #71 | Exceptional 1.7% |
| Cajuns | 99.5 /100 | #72 | Exceptional 1.7% |
| Immigrants | India | 99.4 /100 | #73 | Exceptional 1.7% |
| Zimbabweans | 99.4 /100 | #74 | Exceptional 1.7% |
| Immigrants | Belgium | 99.3 /100 | #75 | Exceptional 1.7% |
| Cherokee | 99.3 /100 | #76 | Exceptional 1.7% |
| Immigrants | Sweden | 99.3 /100 | #77 | Exceptional 1.7% |
Demographics Similar to Croatians by No Schooling Completed
In terms of no schooling completed, the demographic groups most similar to Croatians are Finnish (1.5%, a difference of 0.010%), Danish (1.5%, a difference of 0.30%), Alaskan Athabascan (1.5%, a difference of 0.41%), Tlingit-Haida (1.5%, a difference of 0.53%), and Welsh (1.5%, a difference of 0.53%).
| Demographics | Rating | Rank | No Schooling Completed |
| Dutch | 100.0 /100 | #10 | Exceptional 1.4% |
| Lithuanians | 100.0 /100 | #11 | Exceptional 1.4% |
| Irish | 100.0 /100 | #12 | Exceptional 1.4% |
| Poles | 100.0 /100 | #13 | Exceptional 1.4% |
| Scotch-Irish | 100.0 /100 | #14 | Exceptional 1.5% |
| Tlingit-Haida | 100.0 /100 | #15 | Exceptional 1.5% |
| Finns | 100.0 /100 | #16 | Exceptional 1.5% |
| Croatians | 100.0 /100 | #17 | Exceptional 1.5% |
| Danes | 100.0 /100 | #18 | Exceptional 1.5% |
| Alaskan Athabascans | 100.0 /100 | #19 | Exceptional 1.5% |
| Welsh | 100.0 /100 | #20 | Exceptional 1.5% |
| Chinese | 100.0 /100 | #21 | Exceptional 1.5% |
| Alaska Natives | 100.0 /100 | #22 | Exceptional 1.5% |
| Europeans | 100.0 /100 | #23 | Exceptional 1.5% |
| Pennsylvania Germans | 100.0 /100 | #24 | Exceptional 1.5% |