Bangladeshi vs Assyrian/Chaldean/Syriac GED/Equivalency
COMPARE
Bangladeshi
Assyrian/Chaldean/Syriac
GED/Equivalency
GED/Equivalency Comparison
Bangladeshis
Assyrians/Chaldeans/Syriacs
83.1%
GED/EQUIVALENCY
0.2/ 100
METRIC RATING
264th/ 347
METRIC RANK
87.0%
GED/EQUIVALENCY
94.8/ 100
METRIC RATING
113th/ 347
METRIC RANK
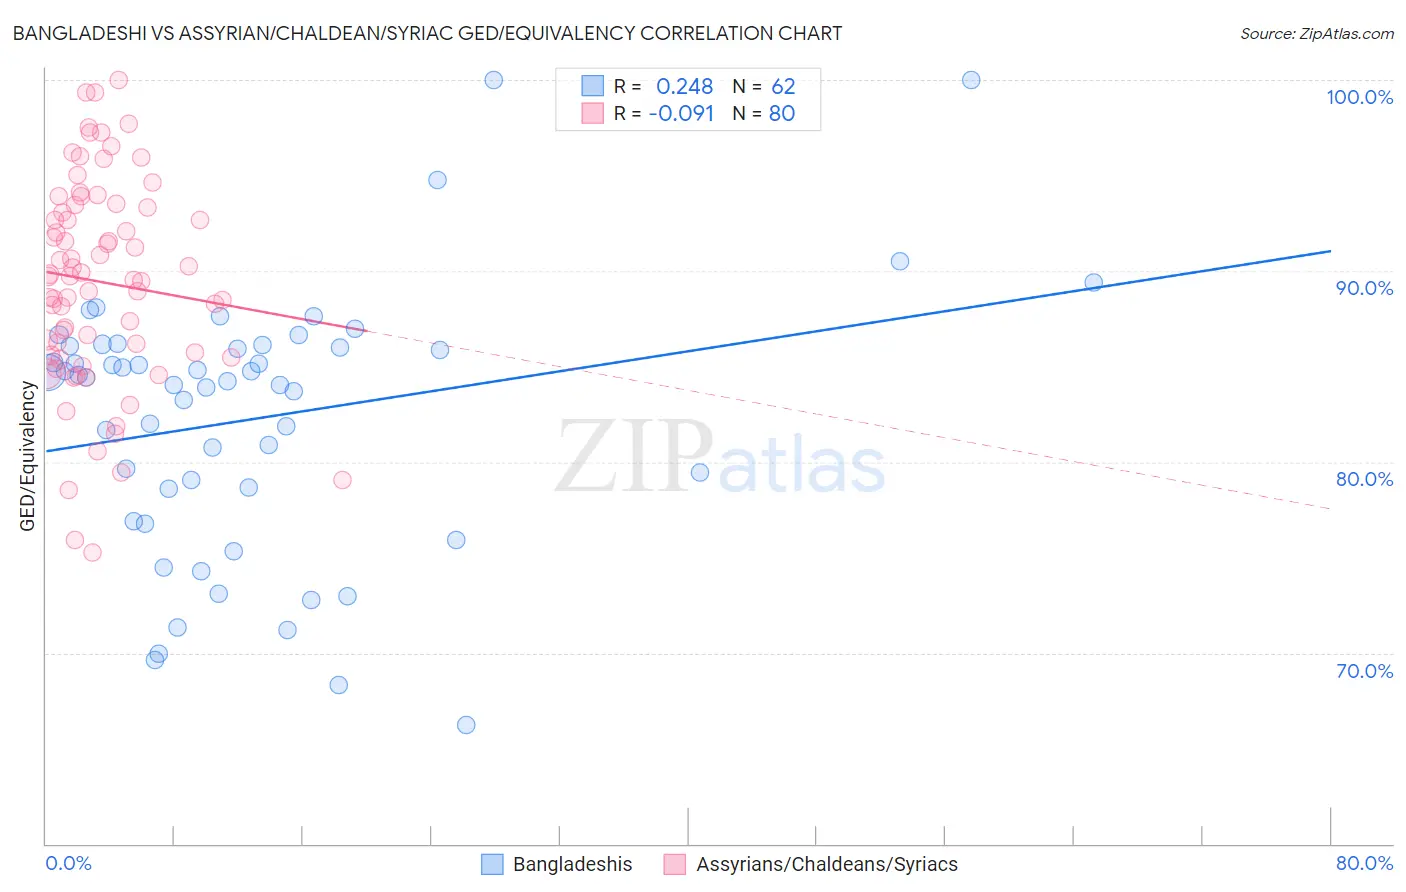
Bangladeshi vs Assyrian/Chaldean/Syriac GED/Equivalency Correlation Chart
The statistical analysis conducted on geographies consisting of 141,450,108 people shows a weak positive correlation between the proportion of Bangladeshis and percentage of population with at least ged/equivalency education in the United States with a correlation coefficient (R) of 0.248 and weighted average of 83.1%. Similarly, the statistical analysis conducted on geographies consisting of 110,318,125 people shows a slight negative correlation between the proportion of Assyrians/Chaldeans/Syriacs and percentage of population with at least ged/equivalency education in the United States with a correlation coefficient (R) of -0.091 and weighted average of 87.0%, a difference of 4.8%.
GED/Equivalency Correlation Summary
| Measurement | Bangladeshi | Assyrian/Chaldean/Syriac |
| Minimum | 66.2% | 75.2% |
| Maximum | 100.0% | 100.0% |
| Range | 33.8% | 24.8% |
| Mean | 82.3% | 89.4% |
| Median | 84.3% | 89.7% |
| Interquartile 25% (IQ1) | 78.6% | 85.7% |
| Interquartile 75% (IQ3) | 86.0% | 93.4% |
| Interquartile Range (IQR) | 7.4% | 7.7% |
| Standard Deviation (Sample) | 6.9% | 5.5% |
| Standard Deviation (Population) | 6.8% | 5.4% |
Similar Demographics by GED/Equivalency
Demographics Similar to Bangladeshis by GED/Equivalency
In terms of ged/equivalency, the demographic groups most similar to Bangladeshis are Immigrants from Congo (83.1%, a difference of 0.010%), West Indian (83.1%, a difference of 0.010%), Kiowa (83.1%, a difference of 0.010%), Inupiat (83.1%, a difference of 0.020%), and Immigrants from Armenia (83.1%, a difference of 0.020%).
| Demographics | Rating | Rank | GED/Equivalency |
| Jamaicans | 0.4 /100 | #257 | Tragic 83.3% |
| Malaysians | 0.4 /100 | #258 | Tragic 83.3% |
| Immigrants | Vietnam | 0.3 /100 | #259 | Tragic 83.2% |
| Choctaw | 0.3 /100 | #260 | Tragic 83.1% |
| Inupiat | 0.2 /100 | #261 | Tragic 83.1% |
| Immigrants | Armenia | 0.2 /100 | #262 | Tragic 83.1% |
| Immigrants | Congo | 0.2 /100 | #263 | Tragic 83.1% |
| Bangladeshis | 0.2 /100 | #264 | Tragic 83.1% |
| West Indians | 0.2 /100 | #265 | Tragic 83.1% |
| Kiowa | 0.2 /100 | #266 | Tragic 83.1% |
| Trinidadians and Tobagonians | 0.2 /100 | #267 | Tragic 83.0% |
| Immigrants | Burma/Myanmar | 0.2 /100 | #268 | Tragic 83.0% |
| Hopi | 0.2 /100 | #269 | Tragic 83.0% |
| Immigrants | Jamaica | 0.2 /100 | #270 | Tragic 82.9% |
| U.S. Virgin Islanders | 0.2 /100 | #271 | Tragic 82.9% |
Demographics Similar to Assyrians/Chaldeans/Syriacs by GED/Equivalency
In terms of ged/equivalency, the demographic groups most similar to Assyrians/Chaldeans/Syriacs are Tlingit-Haida (87.0%, a difference of 0.0%), Immigrants from Kazakhstan (87.0%, a difference of 0.010%), Mongolian (87.0%, a difference of 0.020%), Swiss (87.0%, a difference of 0.030%), and Egyptian (87.1%, a difference of 0.050%).
| Demographics | Rating | Rank | GED/Equivalency |
| Immigrants | Zimbabwe | 95.8 /100 | #106 | Exceptional 87.1% |
| Icelanders | 95.7 /100 | #107 | Exceptional 87.1% |
| Canadians | 95.6 /100 | #108 | Exceptional 87.1% |
| Immigrants | Eastern Europe | 95.5 /100 | #109 | Exceptional 87.1% |
| Egyptians | 95.3 /100 | #110 | Exceptional 87.1% |
| French | 95.2 /100 | #111 | Exceptional 87.1% |
| Tlingit-Haida | 94.8 /100 | #112 | Exceptional 87.0% |
| Assyrians/Chaldeans/Syriacs | 94.8 /100 | #113 | Exceptional 87.0% |
| Immigrants | Kazakhstan | 94.7 /100 | #114 | Exceptional 87.0% |
| Mongolians | 94.6 /100 | #115 | Exceptional 87.0% |
| Swiss | 94.5 /100 | #116 | Exceptional 87.0% |
| Immigrants | Hong Kong | 93.8 /100 | #117 | Exceptional 86.9% |
| French Canadians | 93.2 /100 | #118 | Exceptional 86.9% |
| Immigrants | China | 93.2 /100 | #119 | Exceptional 86.9% |
| Scotch-Irish | 91.6 /100 | #120 | Exceptional 86.8% |